Windows Kernel Debugging: Advanced Techniques with WinDbg
Understanding Kernel Debugging
When your driver crashes Windows at 3 AM, you don’t get a coredump and gdb. You get a BSOD, maybe a memory dump if you’re lucky, and WinDbg - Microsoft’s kernel debugger that feels like stepping back to 1995 until you understand its power.
Why Kernel Debugging Breaks All Your Assumptions
User-space debugging is comfortable. Kernel debugging is hostile. One wrong memory access and the entire machine reboots. No malloc failures, no segfaults, just instant death. The debugger itself runs in kernel mode, sharing address space with your buggy code. And unlike Linux where you can compile modules with debug symbols easily, Windows demands matching PDB files or your call stacks become useless hex dumps.
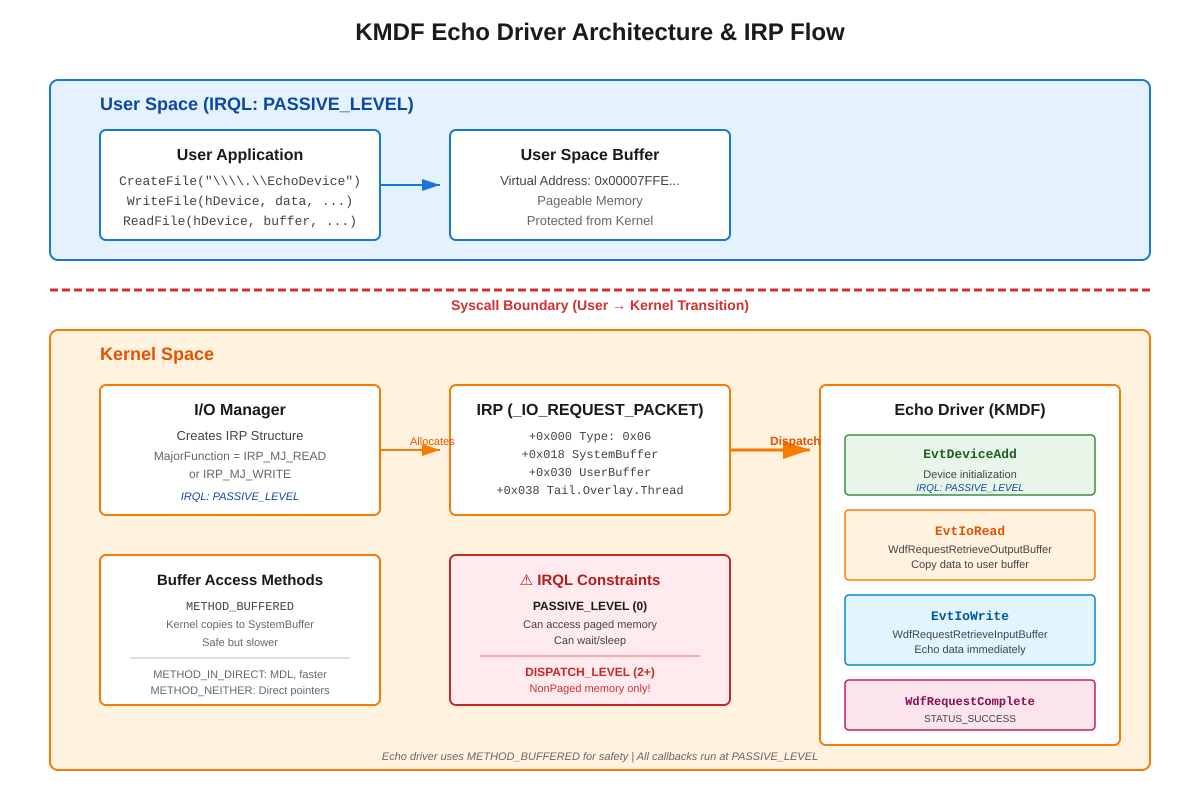
The killer detail nobody tells you: IRQL (Interrupt Request Level). Your code runs at different privilege levels, and the rules change completely. At PASSIVE_LEVEL you can allocate paged memory and call most APIs. At DISPATCH_LEVEL or higher, touching paged memory causes PAGE_FAULT_IN_NONPAGED_AREA crashes. Sleep functions become illegal. Even DbgPrint has restrictions. This isn’t documentation trivia - this is why production drivers crash under load when timing changes slightly.