
Why Your 99th Percentile Latency Matters More Than Average Response Time | Systems Engineering
Today, we're not just talking about it—we're building a system that demonstrates it and then fixing it. We will:
Build a simple request-handling service that simulates normal and high-latency responses.
Implement a client to hammer the service and measure p50, p90, and p99 latencies.
Introduce a controlled "tail latency" problem to see the p99 spike in action.
Instrument our code to pinpoint the cause of the spike.
Fix the problem with a smart, production-ready solution.
Core Concepts: Understanding Percentile Latency
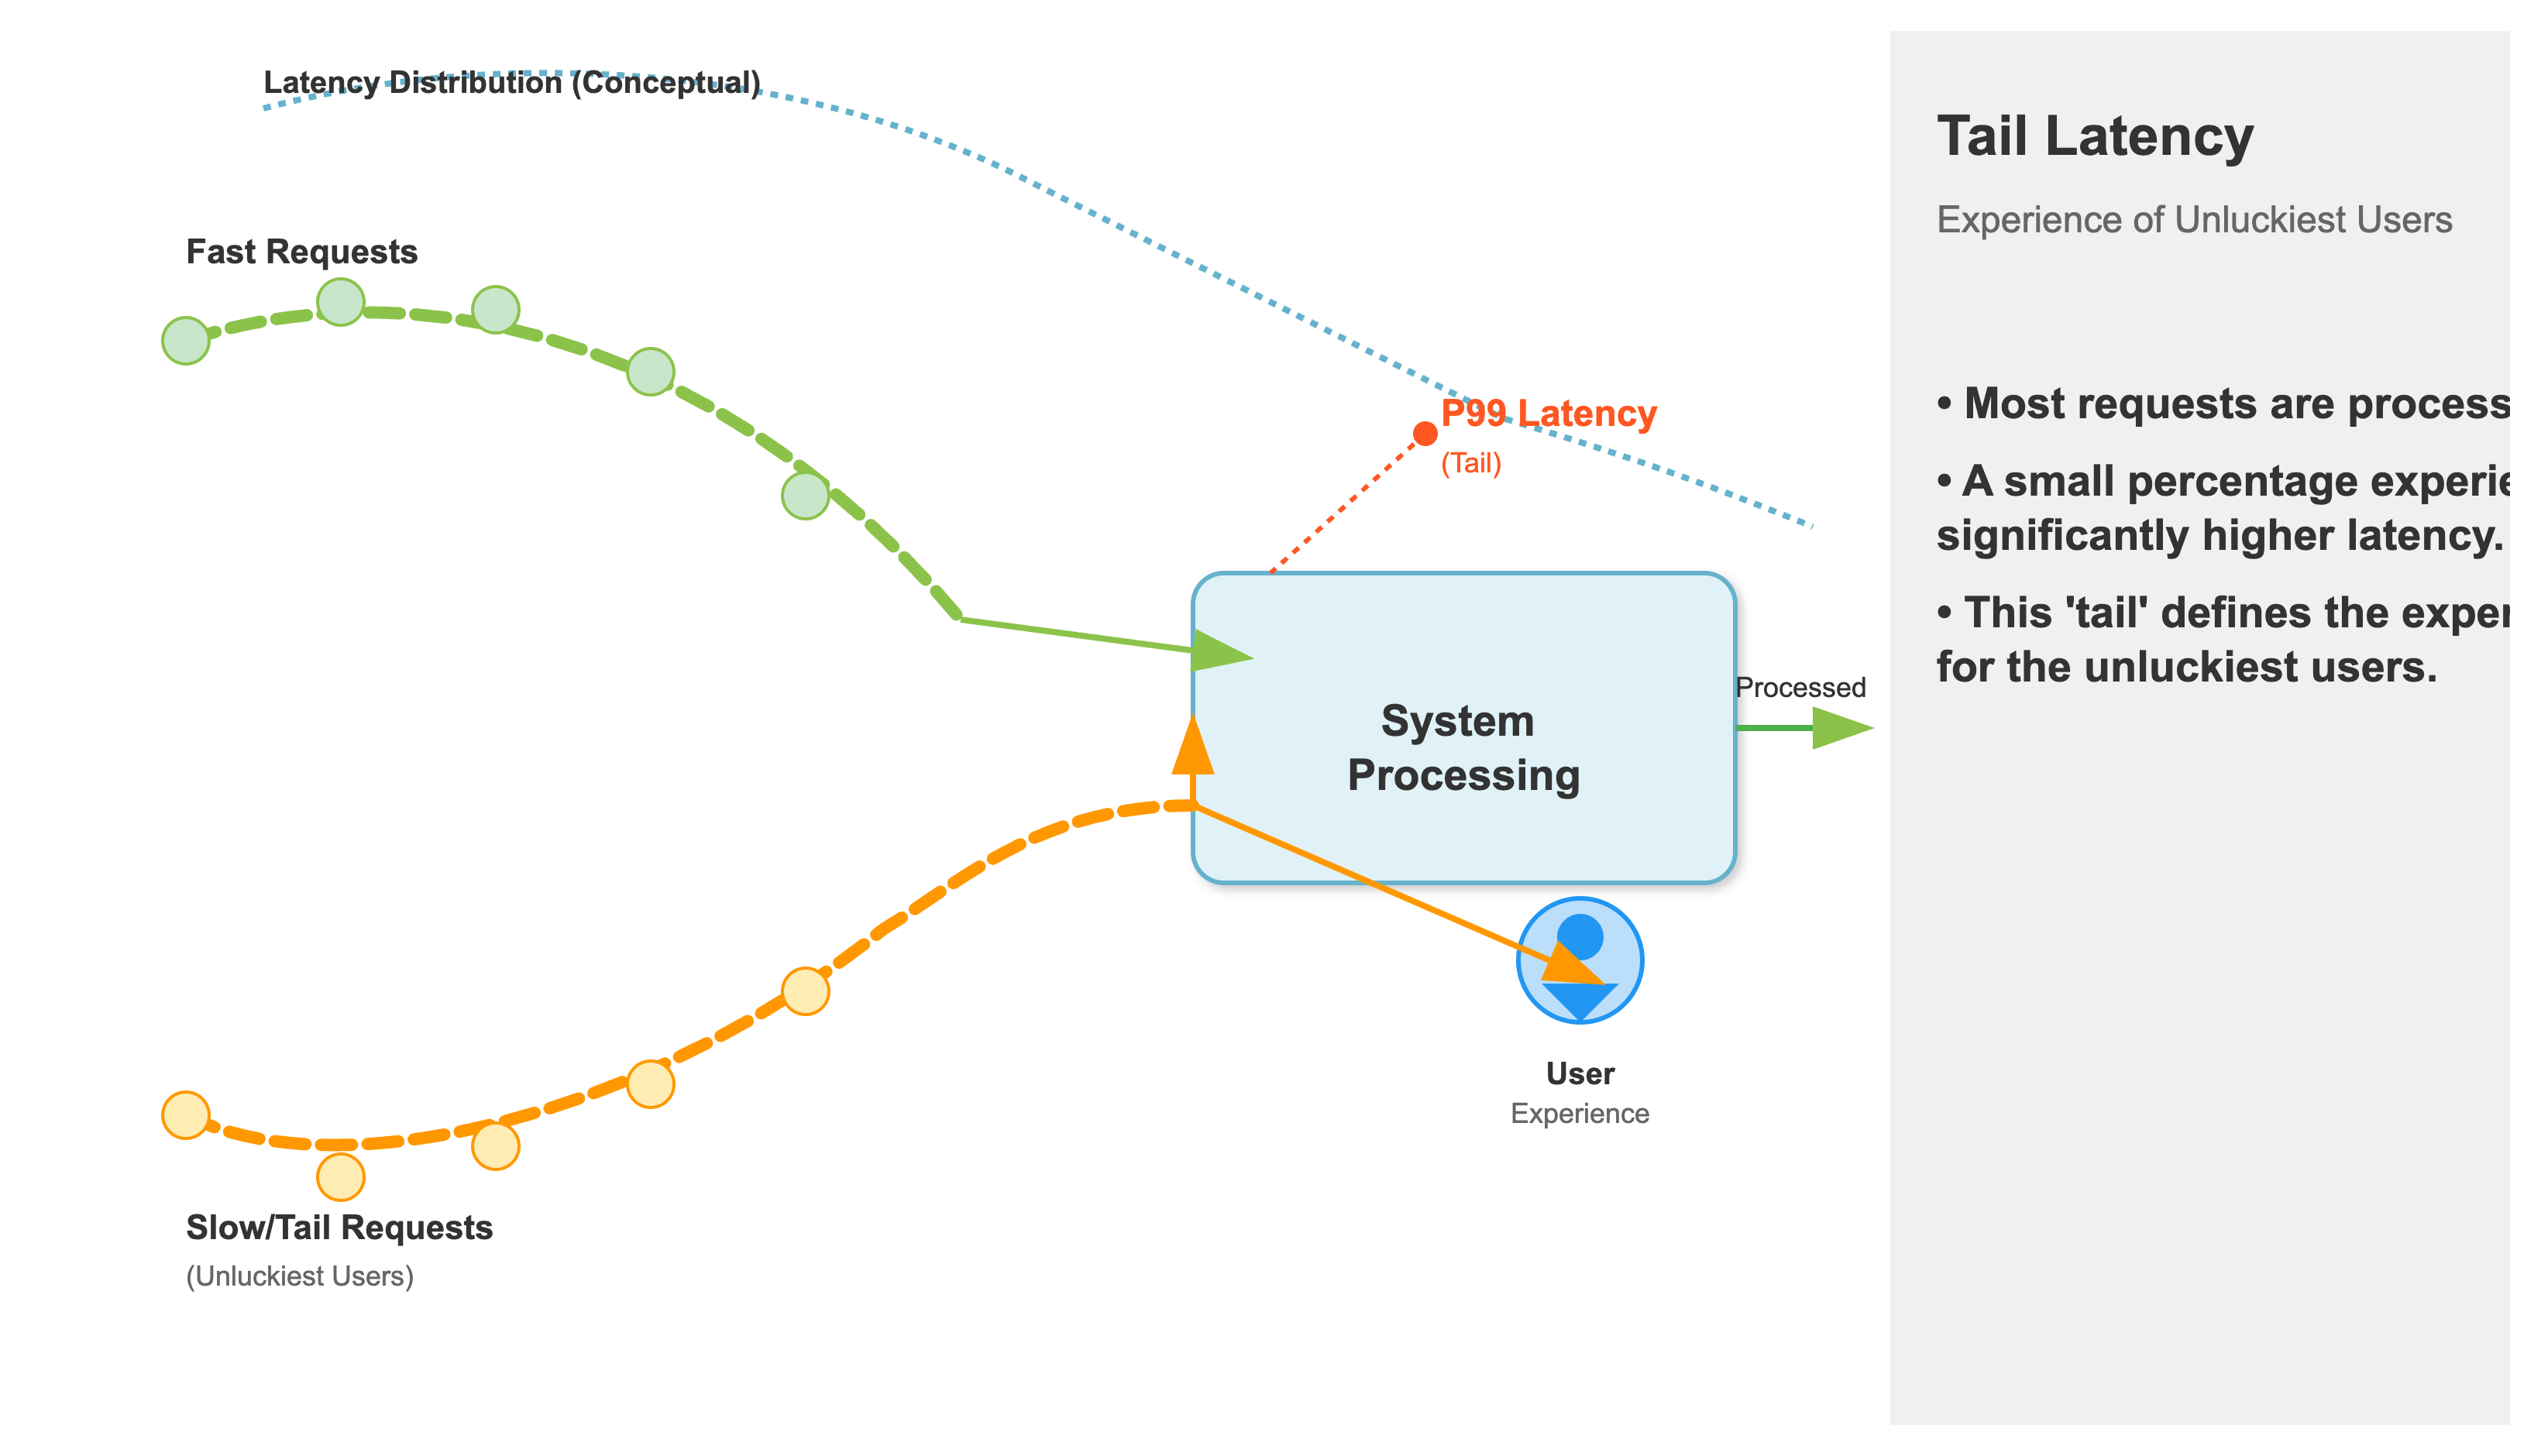
Most people think about average latency. "My service responds in 100ms on average." That sounds good, right? But averages can be incredibly misleading. Imagine 99 requests complete in 50ms, and one request takes 5 seconds. The average is still low, but that one user is staring at a frozen screen.
This is where percentiles come in.
p50 (Median) Latency: 50% of requests are faster than this value.
p90 Latency: 90% of requests are faster than this value.
p99 Latency: 99% of requests are faster than this value. This is the "tail" of the latency distribution, and it's where the most frustrating user experiences live.
A p99 latency spike happens when a small, but significant, portion of your requests suddenly get much slower. The p50 and p90 might not even budge, but that p99 value will shoot up like a rocket
The Culprit: Tail Latency
So, what causes these spikes? In a complex distributed system, it's rarely one thing. Common culprits include:
Garbage Collection Pauses: A sudden pause as the language runtime cleans up memory.
Resource Contention: A few requests get stuck waiting for a lock, a thread, or a slow network call.
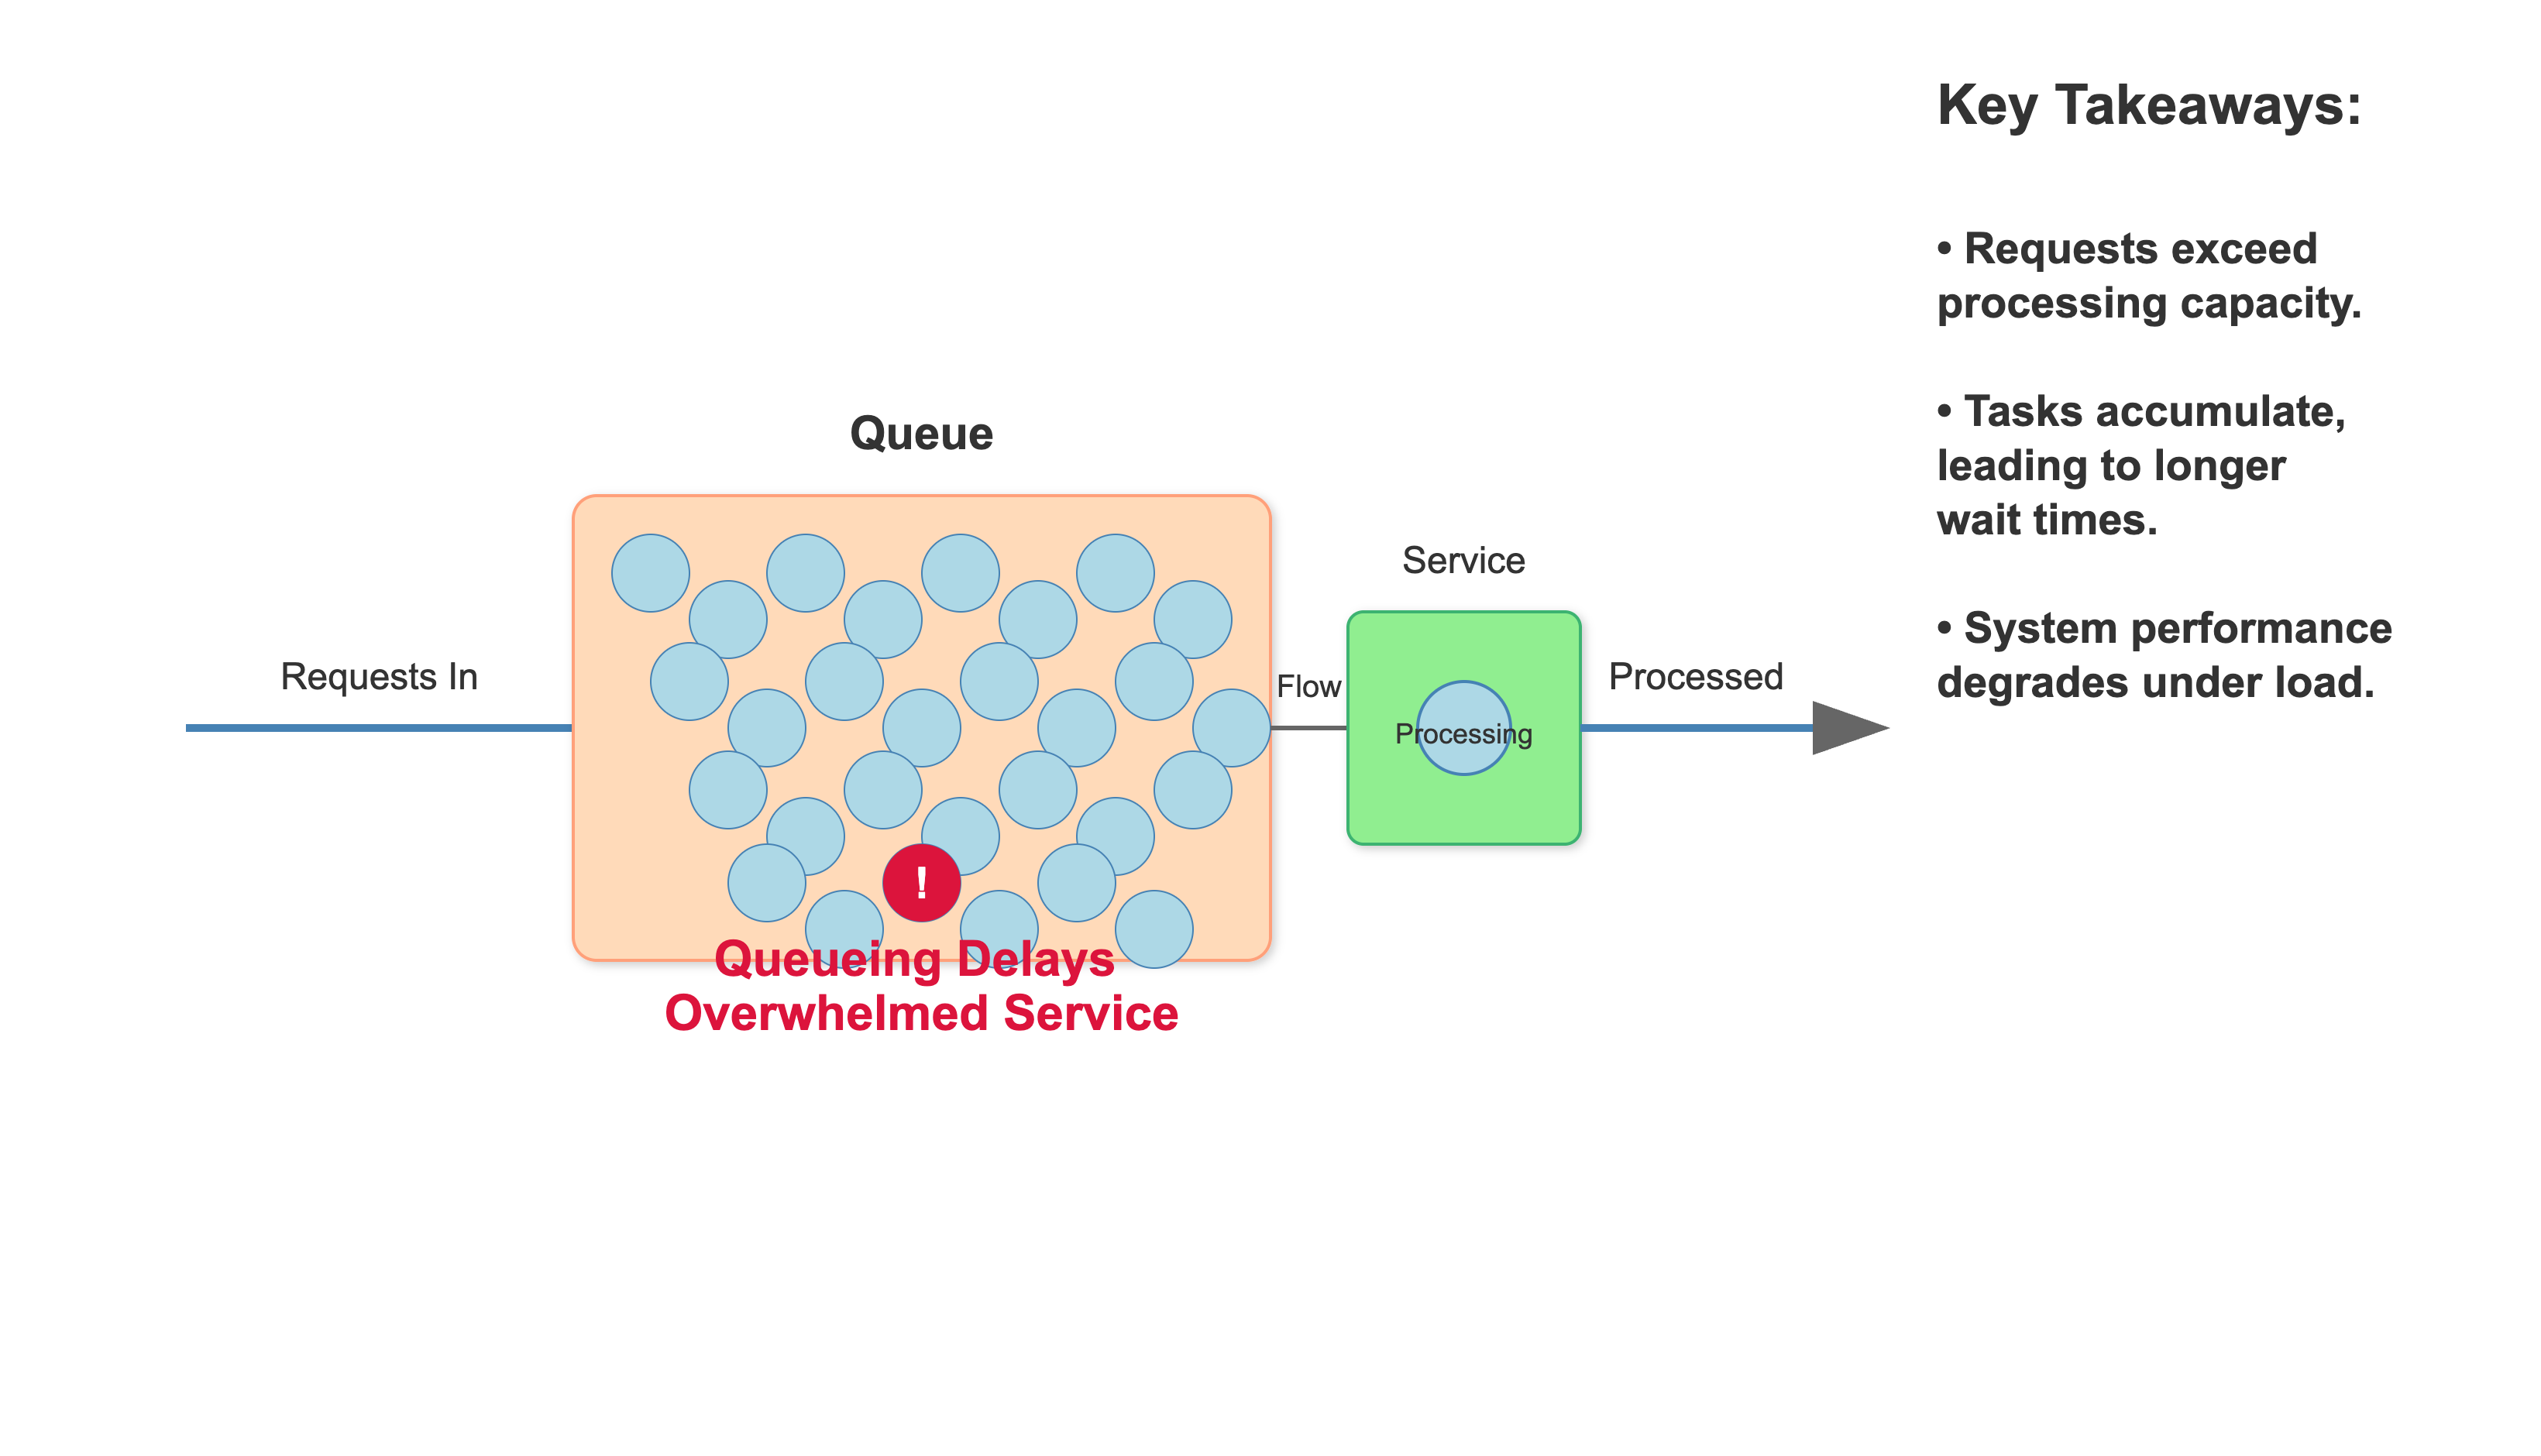
Queueing Delays: A burst of traffic fills up a queue, and a few requests get stuck at the back.
I/O or Disk Slowness: A specific request hits a cold cache or a slow disk block.
Today, we will simulate a Resource Contention issue. A small, controlled group of requests will be deliberately slowed down to simulate a real-world tail latency problem, and we'll see how our p99 metric immediately gives us the full picture.
The System We're Building
Our system is a simplified client-server model. The client is a load generator that sends thousands of requests to our server. The server has two endpoints: one is fast, and the other is a bit slow. Our goal is to measure the latency from the client's perspective and see the impact of that slow endpoint on the overall system's p99 latency.
Architecture:
Load Generator (Frontend Client): A ReactJS application that sends concurrent HTTP requests to our backend and measures the response times. We'll display the latency percentiles on the UI.
Latency-Spiking Service (Backend): A simple Python Flask web server with two endpoints:
/fast: Responds quickly, simulating a typical operation./slow: Intentionally introduces a delay, simulating a long-running task.
Data Flow:
The frontend client starts making concurrent requests to the backend. Most of the time, it hits
/fast, but occasionally, we'll route it to/slow.The backend processes the request and sends a response.
The frontend records the time taken for each request.
After a set number of requests, the frontend calculates and displays the p50, p90, and p99 latencies on the web page.
This setup allows us to precisely control the "slow" requests and observe their effect on the tail latency metrics, providing a crystal-clear demonstration of the p99 problem.
How to Implement, Build, Test and Demo
Step-by-Step Guide
This hands-on guide will walk you through setting up and running the demo. We'll build our Python backend and React frontend, then we'll observe the p99 latency spike in action on a live webpage.
1. Project Structure:
First, create the necessary folders and files. We'll have a backend directory for our Python service and a frontend directory for our React app.
Command:
mkdir -p p99-spike-demo/{backend,frontend}Expected Output: Creates a
p99-spike-demodirectory withbackendandfrontendsubdirectories.
2. Building the Backend with Python:
Our backend is a simple Flask application. We'll define two API routes: /fast and /slow.
Command:
cd p99-spike-demo/backendCommand: Create a file named
requirements.txtwithFlaskandFlask-Corsas dependencies.Command: Create a file named
app.pyinside thebackenddirectory.Pseudo-code snippet for
app.py:Python
# ... imports
@app.route('/fast')
def fast_endpoint():
    return {"message": "Fast response!"}

@app.route('/slow')
def slow_endpoint():
    time.sleep(0.5)  # The culprit!
    return {"message": "Slow response!"}
Command (with Docker): Use the provided
Dockerfileanddocker-compose.ymlto build and run the service.Command:
docker-compose -f ../docker-compose.yml up --build -d
3. Building the Frontend with React:
The frontend will be a single-page application that orchestrates the load test and displays the results. We'll use React's useState hook to manage the UI state and display our metrics in real-time.
Command:
cd ../frontendCommand: Create a
package.jsonfile with React dependencies.Command: Create
src/App.js,src/index.js, andsrc/index.cssfiles.Pseudo-code snippet for
App.js:JavaScript
import React, { useState } from 'react';
// ... other imports and constants

function App() {
  const [p50, setP50] = useState(null);
  // ... other state variables

  const runTest = async () => {
    // ... reset state, set loading
    const latencies = [];
    for (let i = 0; i < NUM_REQUESTS; i++) {
      // Decide to hit /fast or /slow
      const url = (Math.random() < 0.01) ? '/slow' : '/fast';
      const start = performance.now();
      await fetch(url);
      latencies.push(performance.now() - start);
    }

    // ... calculate and display percentiles
    const p99Val = latencies[Math.floor(latencies.length * 0.99)];
    setP99(p99Val.toFixed(2));
  };

  return (
    // ... UI components with metrics
  );
}
Command:
npm installCommand:
npm start
4. Run the Demo & Verify the Spike:
Command: In one terminal, start the backend with
docker-compose up -d.Command: In a second terminal, start the frontend with
npm start.Expected Behavior: Your web browser should open to
http://localhost:3000
. Click the "Run Test" button. After a moment, you'll see the P50, P90, and P99 latency values populate. The P99 value will be dramatically higher, around 500ms, showcasing the spike.
5. Assignment: The Fix
Your assignment is to modify the client's logic to be more resilient. The problem with a high p99 latency is that it can cause clients to wait unnecessarily, consuming resources.
The Problem: The current
fetchrequests will wait until the server responds, even on the/slowendpoint. In a real-world scenario, this could lead to a slow user experience.Your Mission: Modify the frontend
fetchcall to use anAbortControllerto implement a client-side timeout. Set a timeout of, say, 100ms. If a request doesn't complete within that time,abortit and record atimeoutevent instead of a latency value.Hint: Create a new
AbortControllerinstance before eachfetchcall. Pass thesignalto thefetchoptions. UsesetTimeoutto callcontroller.abort()after the timeout duration.
6. Solution Hints:
Step 1: In
App.js, create a newAbortControllerbefore thefetchcall:const controller = new AbortController();Step 2: Define your timeout duration:
const timeoutId = setTimeout(() => controller.abort(), 100);Step 3: Pass the signal to
fetch:await fetch(url, { signal: controller.signal });Step 4: In your
try...catchblock, check if the error is due to an abort:if (error.name === 'AbortError') { latencies.push(100); }(you can log a specific timeout value).Step 5: Crucially, use
clearTimeout(timeoutId)in afinallyblock to prevent memory leaks.
This fix is a critical, production-ready pattern that prevents slow dependencies from consuming client resources and causing cascading failures.