
Tuning SCHED_BATCH for Non-Interactive, CPU-Bound Workloads
Most engineers reach for
nicewhen they want to deprioritize a batch job. It works — until it doesn’t. You lower the nice value, the batch job stops dominating the runqueue, and then, six months later, someone complains that the HTTP service latency spikes every time the nightly training job kicks in. You strace the web service, see nothing unusual, runperf sched latency, and find something uncomfortable: the batch workers are waking up constantly — after every I/O completion, every futex signal — and each wakeup triggers the CFS preemption check against your latency-sensitive threads.This is where
SCHED_BATCHbelongs in your toolbox, and why most articles don’t explain it correctly.
What SCHED_BATCH Actually Changes
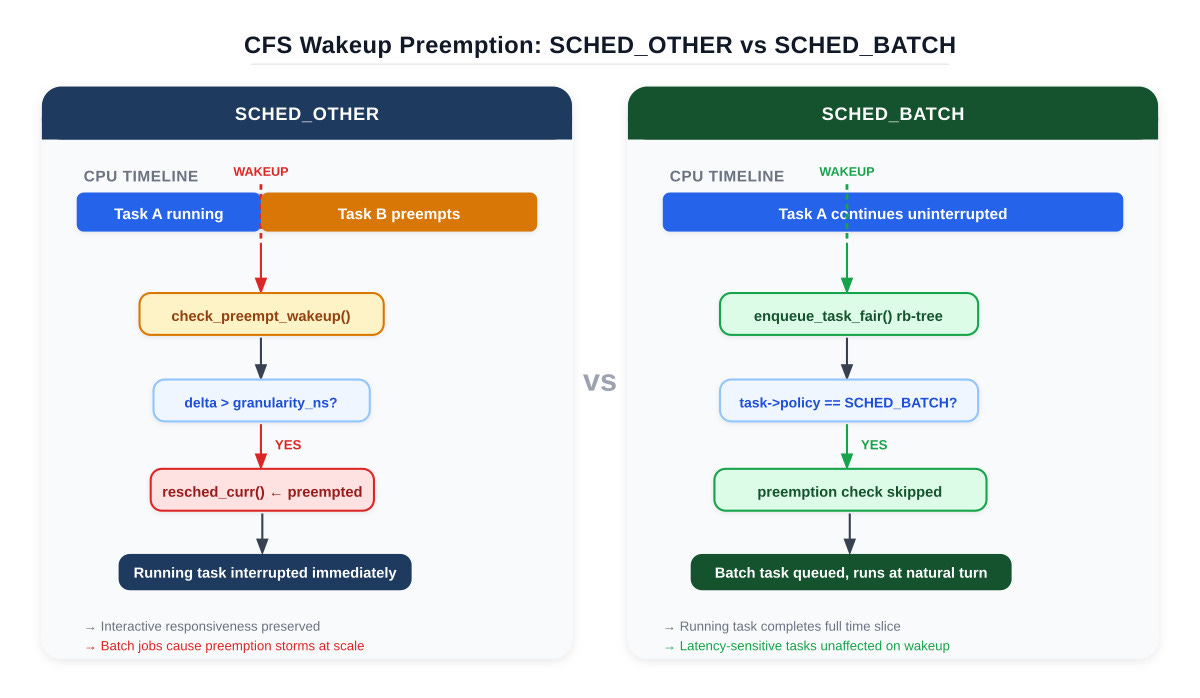
SCHED_BATCH is not a priority class. It is a scheduling policy that modifies one specific behavior in the CFS wakeup path: preemption on wakeup is suppressed.
When a SCHED_OTHER task wakes up from sleep, check_preempt_wakeup() runs immediately. If the waking task’s vruntime is sufficiently smaller than the current task’s vruntime — the delta exceeds sched_wakeup_granularity_ns — the scheduler issues resched_curr() and the current task is kicked off the CPU. This is how interactive tasks stay responsive.
For a SCHED_BATCH task, that path is bypassed. The task is enqueued in the CFS red-black tree, but the currently running thread is not preempted. The batch task runs when it reaches the front of the runqueue naturally. This is the only semantic difference between SCHED_BATCH and SCHED_OTHER. CPU share allocation — governed by weight derived from nice — is identical.
[SCHED_OTHER wakeup]                [SCHED_BATCH wakeup]
   task wakes                          task wakes
       |                                   |
  check_preempt_wakeup()             enqueue to rb-tree
       |                                   |
  vruntime delta > granularity?      no preemption check
       |                                   |
  yes → resched_curr()               waits for natural turn
  running task preempted
Why nice Alone Is Insufficient
A batch job running at nice +19 has roughly 1/15th the CPU weight of a nice 0 task. But it still preempts. Every time a batch worker wakes from an epoll_wait, a read(), or a pthread_cond_signal(), it fires check_preempt_wakeup(). At scale — 32 batch workers all doing intermittent I/O alongside 8 HTTP worker threads — the interrupt storm from preemption checks is measurable in perf sched as scheduling latency variance, not CPU utilization.
Raising /proc/sys/kernel/sched_wakeup_granularity_ns (default: 1,000,000 ns on most distributions) can dampen this, but it’s a global knob. It affects every SCHED_OTHER task on the system, including your interactive services. SCHED_BATCH gives you targeted behavior without touching global tunables.
The Kernel Path
sched_setscheduler(pid, SCHED_BATCH, ¶m) requires no elevated privileges for non-real-time policies. param.sched_priority must be 0. After the call, task_struct->policy is set to SCHED_BATCH, and task_has_dl_policy() / task_has_rt_policy() both return false. The task remains in the CFS domain.
fork() inherits the policy. If your batch process spawns a thread pool after setting SCHED_BATCH, every worker thread inherits it automatically. This means you set it once — on the parent process — and every child thread is correctly classified without per-thread syscalls.
From /proc/[pid]/sched, watch nr_involuntary_switches. Under SCHED_OTHER, a CPU-bound batch job typically shows a high involuntary switch rate as the scheduler reclaims the CPU for higher-priority wakeups. Under SCHED_BATCH, involuntary switches drop sharply — the task runs to completion of its time slice more often. Voluntary switches (I/O, sleep) remain unchanged.
CPUfreq Interaction You Probably Haven’t Considered
The schedutil governor derives its frequency request from per-CPU utilization signals. SCHED_BATCH tasks contribute to util_avg identically to SCHED_OTHER. However, the UTIL_EST utilization estimation path treats tasks that run in long uninterrupted bursts differently from tasks that show high wakeup frequency. A batch task that runs for 10ms per activation contributes a different frequency hint than ten 1ms activations, even with the same total CPU time.
On Intel hardware with HWP (Hardware-managed P-states), the effect is amplified: the processor’s own activity hints bias toward lower P-states for tasks with low wakeup rates. For sustained compute workloads — matrix multiplication, compression, hashing — pin the cpufreq governor to performance or set energy_performance_preference to performance via cpupower. Otherwise you pay a frequency penalty on top of everything else.
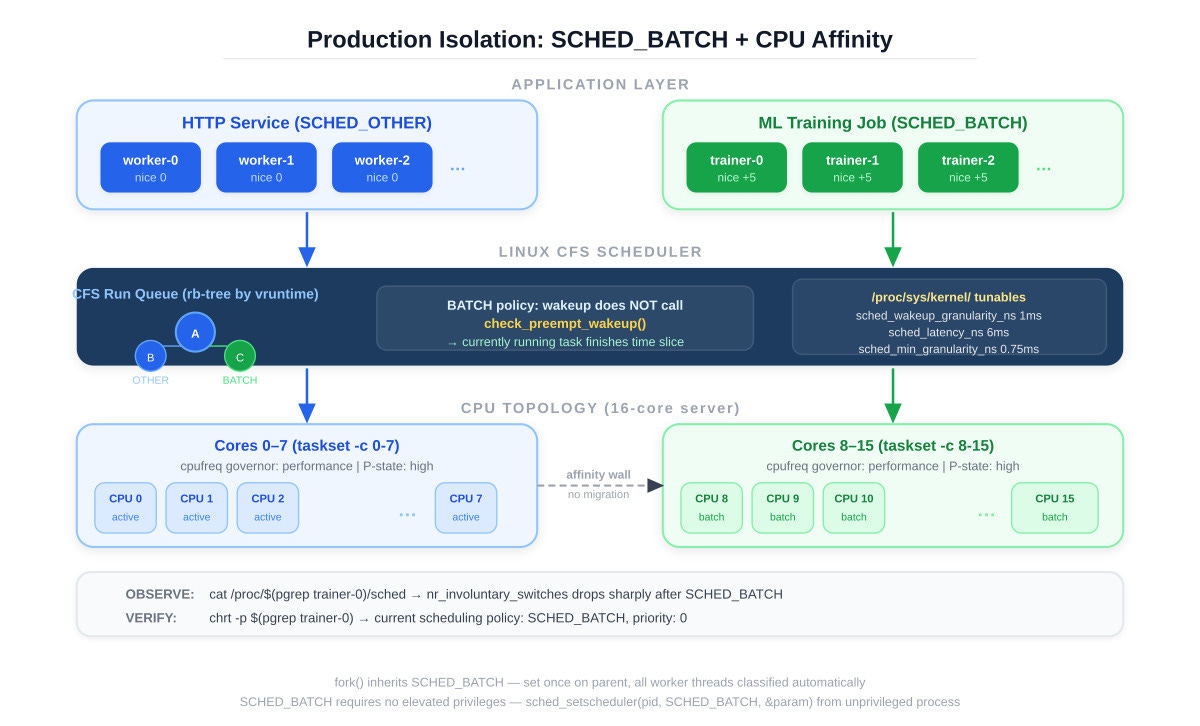
Combining the Knobs
The pattern that works in production: SCHED_BATCH plus nice +5 plus CPU affinity if you have cores to spare, plus performance governor on batch-designated CPUs. SCHED_BATCH alone handles wakeup preemption. The nice value adjusts CPU share when the system is genuinely saturated. CPU affinity prevents NUMA cross-node migrations from poisoning cache locality. Together they give you predictable batch throughput without touching global scheduler tunables or deploying cgroup hierarchies.
struct sched_param param = { .sched_priority = 0 };
sched_setscheduler(0, SCHED_BATCH, ¶m);
setpriority(PRIO_PROCESS, 0, 5);
Verify it took effect with chrt -p $(pgrep your_worker) and inspect /proc/$(pgrep your_worker)/sched for the switch counts. Run perf sched latency -p <interactive_pid> before and after. The max scheduling latency for your interactive service should drop. That number is what you show your SRE team.
Part II — Building and Running the Demo
Github Link:
https://github.com/sysdr/howtech/tree/main/day80
The benchmark that ships with this article puts two groups of threads on the same CPU simultaneously: four interactive threads that wake every millisecond and measure how long the kernel takes to actually schedule them, and four batch threads running a tight FNV-1a compute loop with no sleep at all. The point is to observe context-switch behavior from /proc, not to manufacture artificial load.
Prerequisites
You need gcc, make, strace, and procps. The ncurses monitor needs libncurses-dev but is optional — the benchmark itself runs without it.
sudo apt-get install build-essential libncurses-dev strace procps
To build both programs:
make all
This compiles sched_bench (the benchmark) and sched_monitor (the ncurses dashboard) with -Wall -Wextra -Werror -O2. Both produce zero warnings. If you are inside a Docker container and want SCHED_BATCH to actually take effect rather than silently fall back to SCHED_OTHER, pass --cap-add SYS_NICE to docker run. On bare metal, no elevated privileges are required.
Reading the Scheduler Tunables First
Before running anything, look at the three knobs that govern CFS scheduling periods on your machine:
cat /proc/sys/kernel/sched_latency_ns
cat /proc/sys/kernel/sched_min_granularity_ns
cat /proc/sys/kernel/sched_wakeup_granularity_ns
On a typical Ubuntu 22.04 installation you will see 6,000,000 ns, 750,000 ns, and 1,000,000 ns respectively. The third value — sched_wakeup_granularity_ns — is the one that matters here. It is the minimum vruntime advantage a waking SCHED_OTHER task needs before it can preempt the currently running task. SCHED_BATCH ignores this number entirely. The wakeup preemption check is skipped regardless of what this value is set to. Keep that in mind when the benchmark results come in — the protection SCHED_BATCH gives you is not something a tunable can replicate selectively.
Running the Benchmark
./sched_bench
The program spawns all eight threads simultaneously behind a barrier so they start at the same instant, then races them for 500 iterations each. When it finishes, it prints three sections.
The first section shows wakeup latency for each interactive thread: the minimum, mean, p99, and maximum time between the scheduled wakeup point and the moment the thread actually ran. These numbers are in microseconds. The mean will typically be in the 100–200 µs range; what matters is the p99 and max. Those are the numbers that show up in your application’s tail latency.
The second section shows batch thread throughput: how many FNV-1a hash iterations each thread completed. This confirms the batch threads were not starved — they got their CPU time, just without the ability to preempt interactive threads on wakeup.
The third section is the one to read carefully:
Interactive invol switches (total): 312
Batch       invol switches (total):  18
Ratio: interactive/batch = 17.33x
An involuntary context switch means the kernel took the CPU away from a running thread before it voluntarily yielded. Under SCHED_OTHER with competing threads, batch workers accumulate involuntary switches rapidly because every I/O wakeup from any thread triggers a preemption check. Under SCHED_BATCH, that path is gone. The batch threads run their time slices to completion far more often, which is exactly what you want for a compute workload: longer uninterrupted runs mean better cache utilization, fewer pipeline flushes, and more predictable throughput.
Verifying the Policy is Set
While the benchmark is running, open a second terminal and run:
chrt -p $(pgrep sched_bench)
You will see output along these lines for each thread:
pid 4821's current scheduling policy: SCHED_BATCH
pid 4821's current scheduling priority: 0
For the interactive threads the policy will read SCHED_OTHER. This confirms that both policies are live in the same process at the same time — one process, eight threads, two distinct scheduler classifications. Then read the raw proc entry:
grep -E "nr_involuntary|nr_voluntary|se.sum_exec" \
     /proc/$(pgrep sched_bench)/task/*/sched
Compare the nr_involuntary_switches rows between the SCHED_OTHER and SCHED_BATCH threads. The gap between them is the preemption storm you are eliminating.
The Syscall Profile
Running the benchmark under strace -c -f gives you the syscall breakdown across all threads:
strace -c -f ./sched_bench 2>&1 | tail -20
The dominant syscalls will be nanosleep (from the interactive threads), clock_gettime (latency measurement), and sched_setscheduler (called once per batch thread at startup). What will not appear in significant quantity is sched_yield — the batch threads never yield voluntarily, they just run until the scheduler takes them off. The interactive threads show a high nanosleep count — 500 calls per thread, 2000 total — because that is the mechanism being measured.
The Live Monitor
If libncurses-dev was available at build time, the monitor runs as a separate program that attaches to any target process by PID:
./sched_bench &
./sched_monitor $!
The dashboard refreshes every 500 ms and shows a row per thread with its scheduling policy (color-coded green for SCHED_BATCH, cyan for SCHED_OTHER), current vruntime in milliseconds, total CPU time consumed, and both voluntary and involuntary switch counts. A horizontal bar at the right edge of each row shows CPU time consumed relative to the most active thread. The summary row at the bottom compares total involuntary switches between the two policy groups — watch this number as the benchmark runs. In a container without SYS_NICE, all threads will show SCHED_OTHER; on bare metal, the split will be visible immediately. Press Q to exit.
Applying This to a Real Workload
From the shell, no code changes required:
chrt --batch 0 ./your_batch_job
With CPU affinity added to keep batch workers off the cores your latency-sensitive service runs on:
taskset -c 8-15 chrt --batch 0 ./your_batch_job
In code, set the policy before spawning your thread pool. Every thread pthread_create produces after this point inherits it:
struct sched_param sp = { .sched_priority = 0 };
sched_setscheduler(0, SCHED_BATCH, &sp);
setpriority(PRIO_PROCESS, 0, 5);   /* optional: reduce CPU share under saturation */

/* spawn threads here — all inherit SCHED_BATCH */
After deploying, run perf sched latency -p <pid_of_interactive_service> with and without SCHED_BATCH on the batch workers. The column to watch is Maximum delay. That is the worst-case scheduling latency your interactive service experiences — the number a preemption storm inflates and that SCHED_BATCH brings back down.
To clean up all build artifacts and stop any lingering processes:
./cleanup.sh