
Shared Library Interposition: How LD_PRELOAD Works and Its Security Implications
Last Tuesday at 2 AM, we had a service leaking 500MB/hour. No core dumps, valgrind too slow for production, and the vendor’s library was a black box. Solution? LD_PRELOAD to wrap malloc and track every allocation without recompiling anything. This is the superpower dynamic linking gives you—and why attackers love it too.
When Function Calls Aren’t What They Seem
Your C program calls
malloc(1024). Simple, right? That call goes through the Procedure Linkage Table (PLT), jumps to a stub that loads the real address from the Global Offset Table (GOT), then finally reaches libc’s malloc. The dynamic linker (ld.so) resolves these symbols at runtime, not compile time. That indirection is your attack surface and your debugging tool.
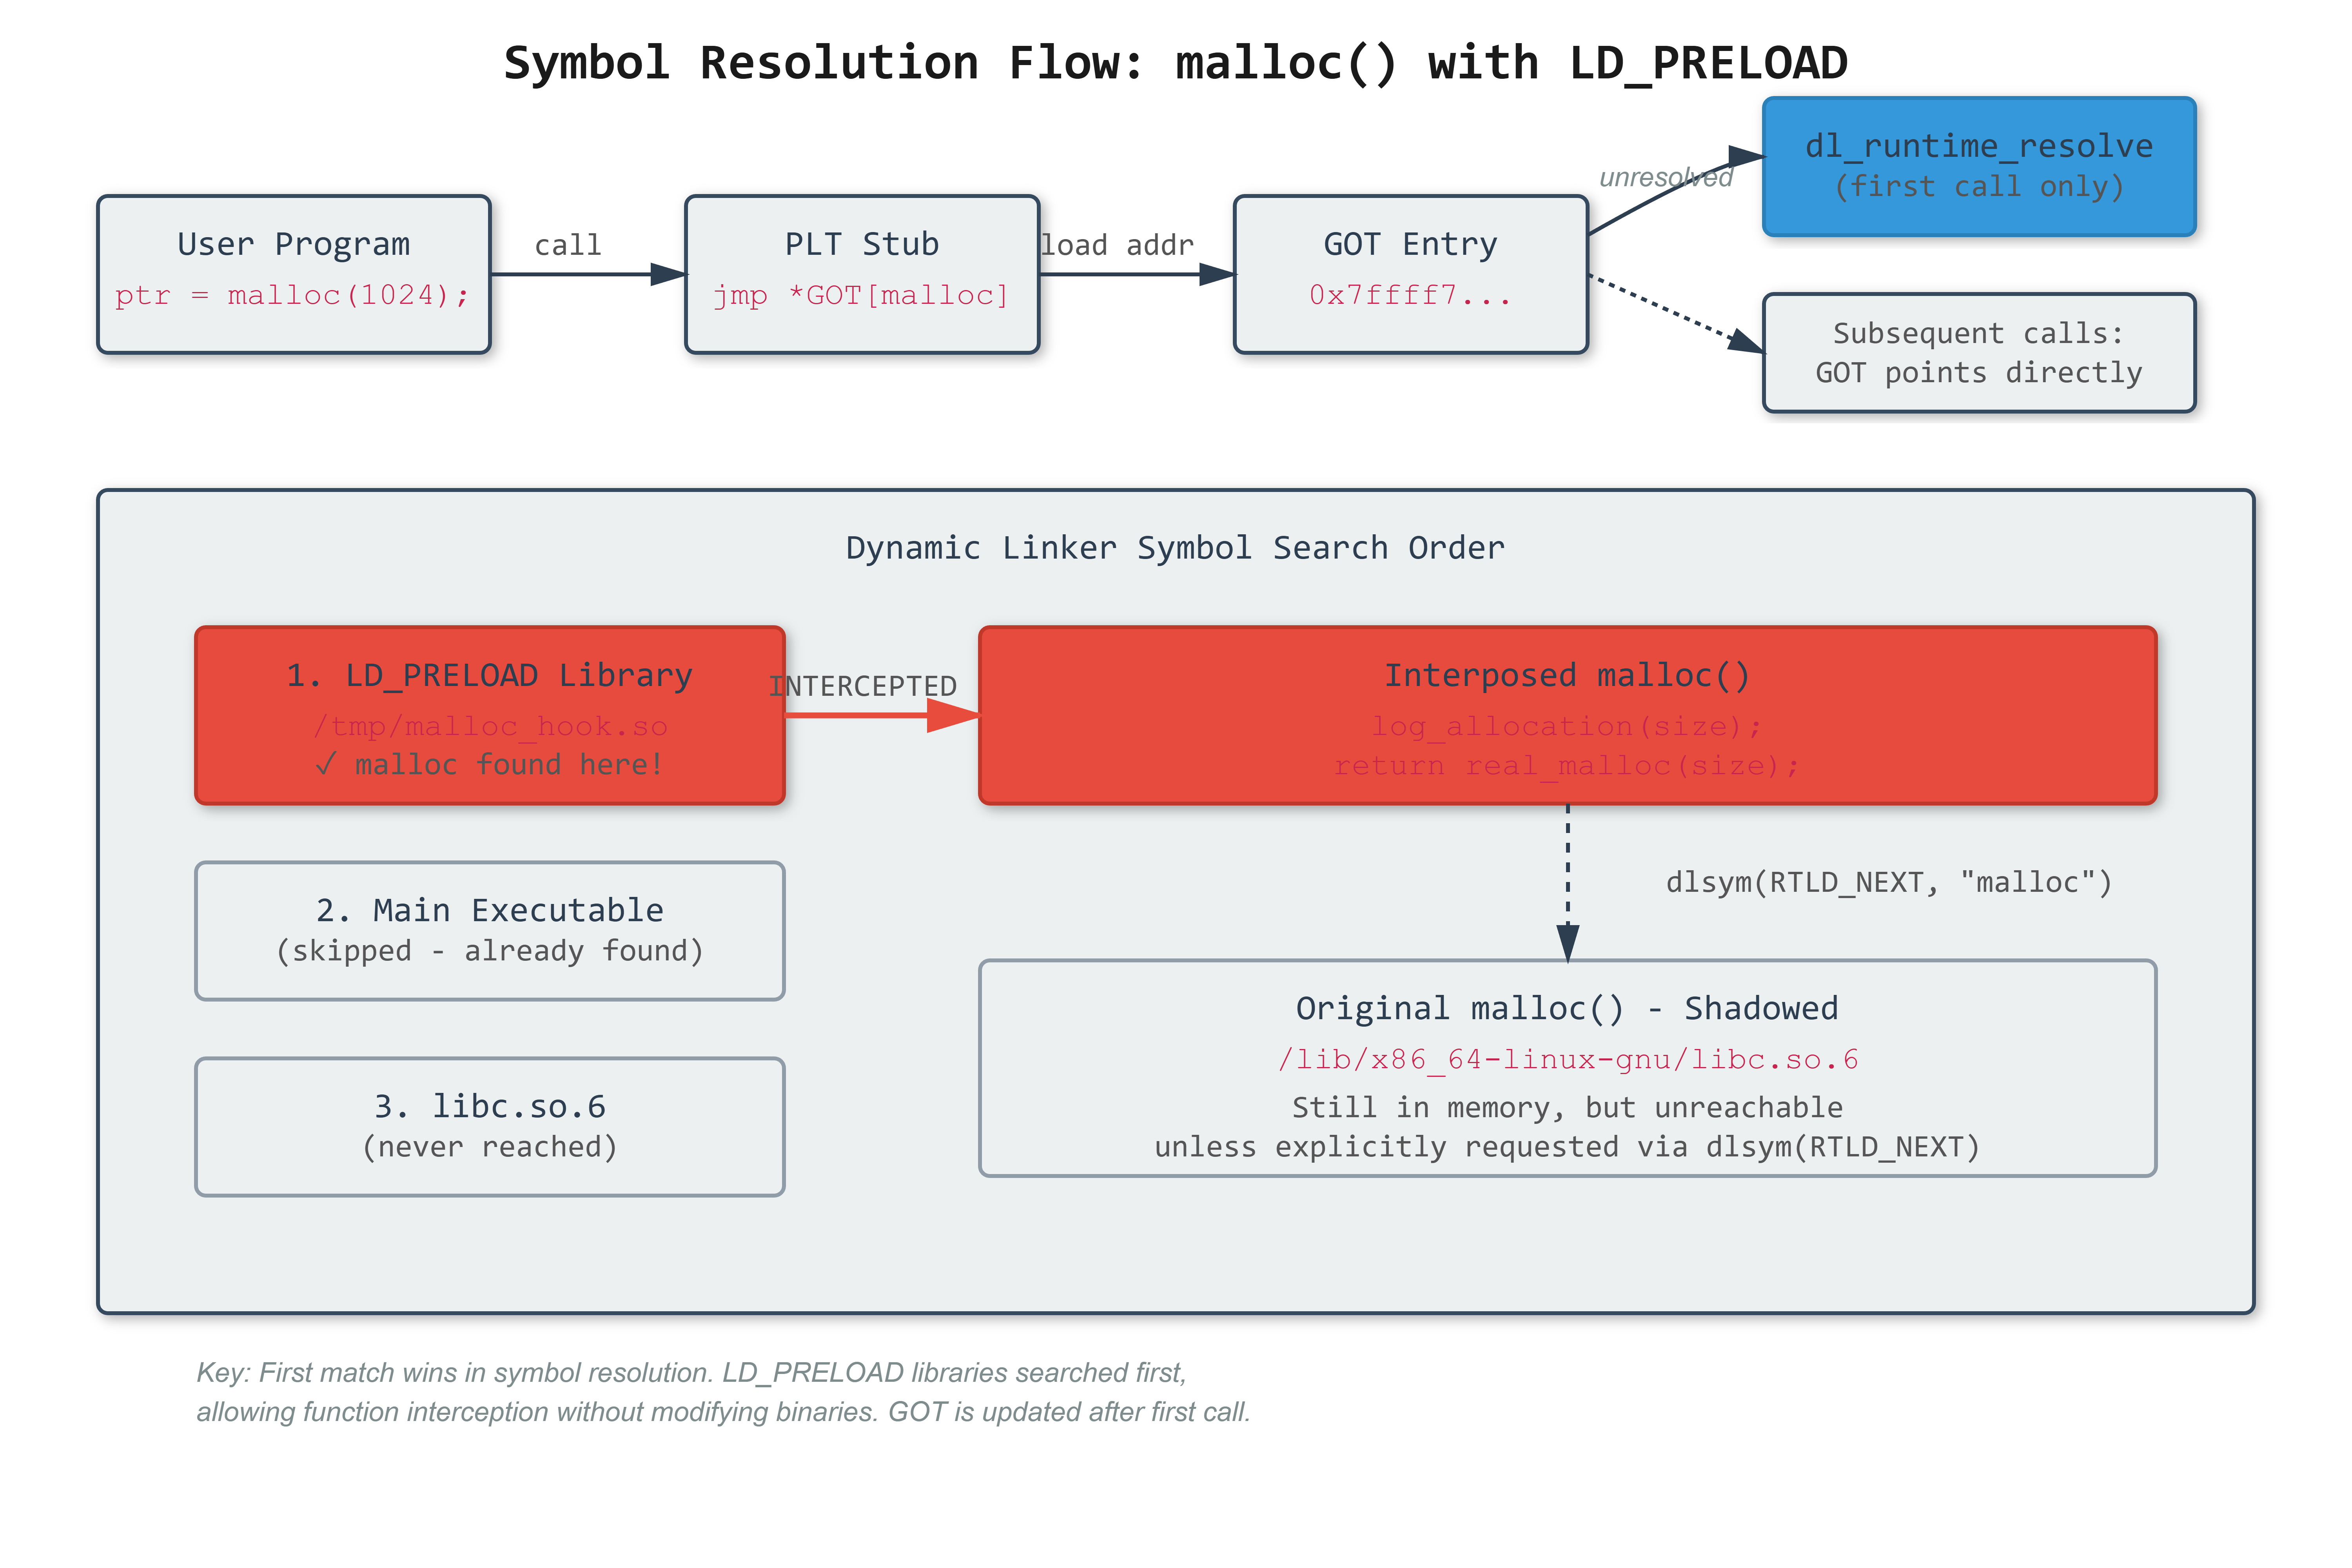
The GOT starts with dummy addresses that trap to
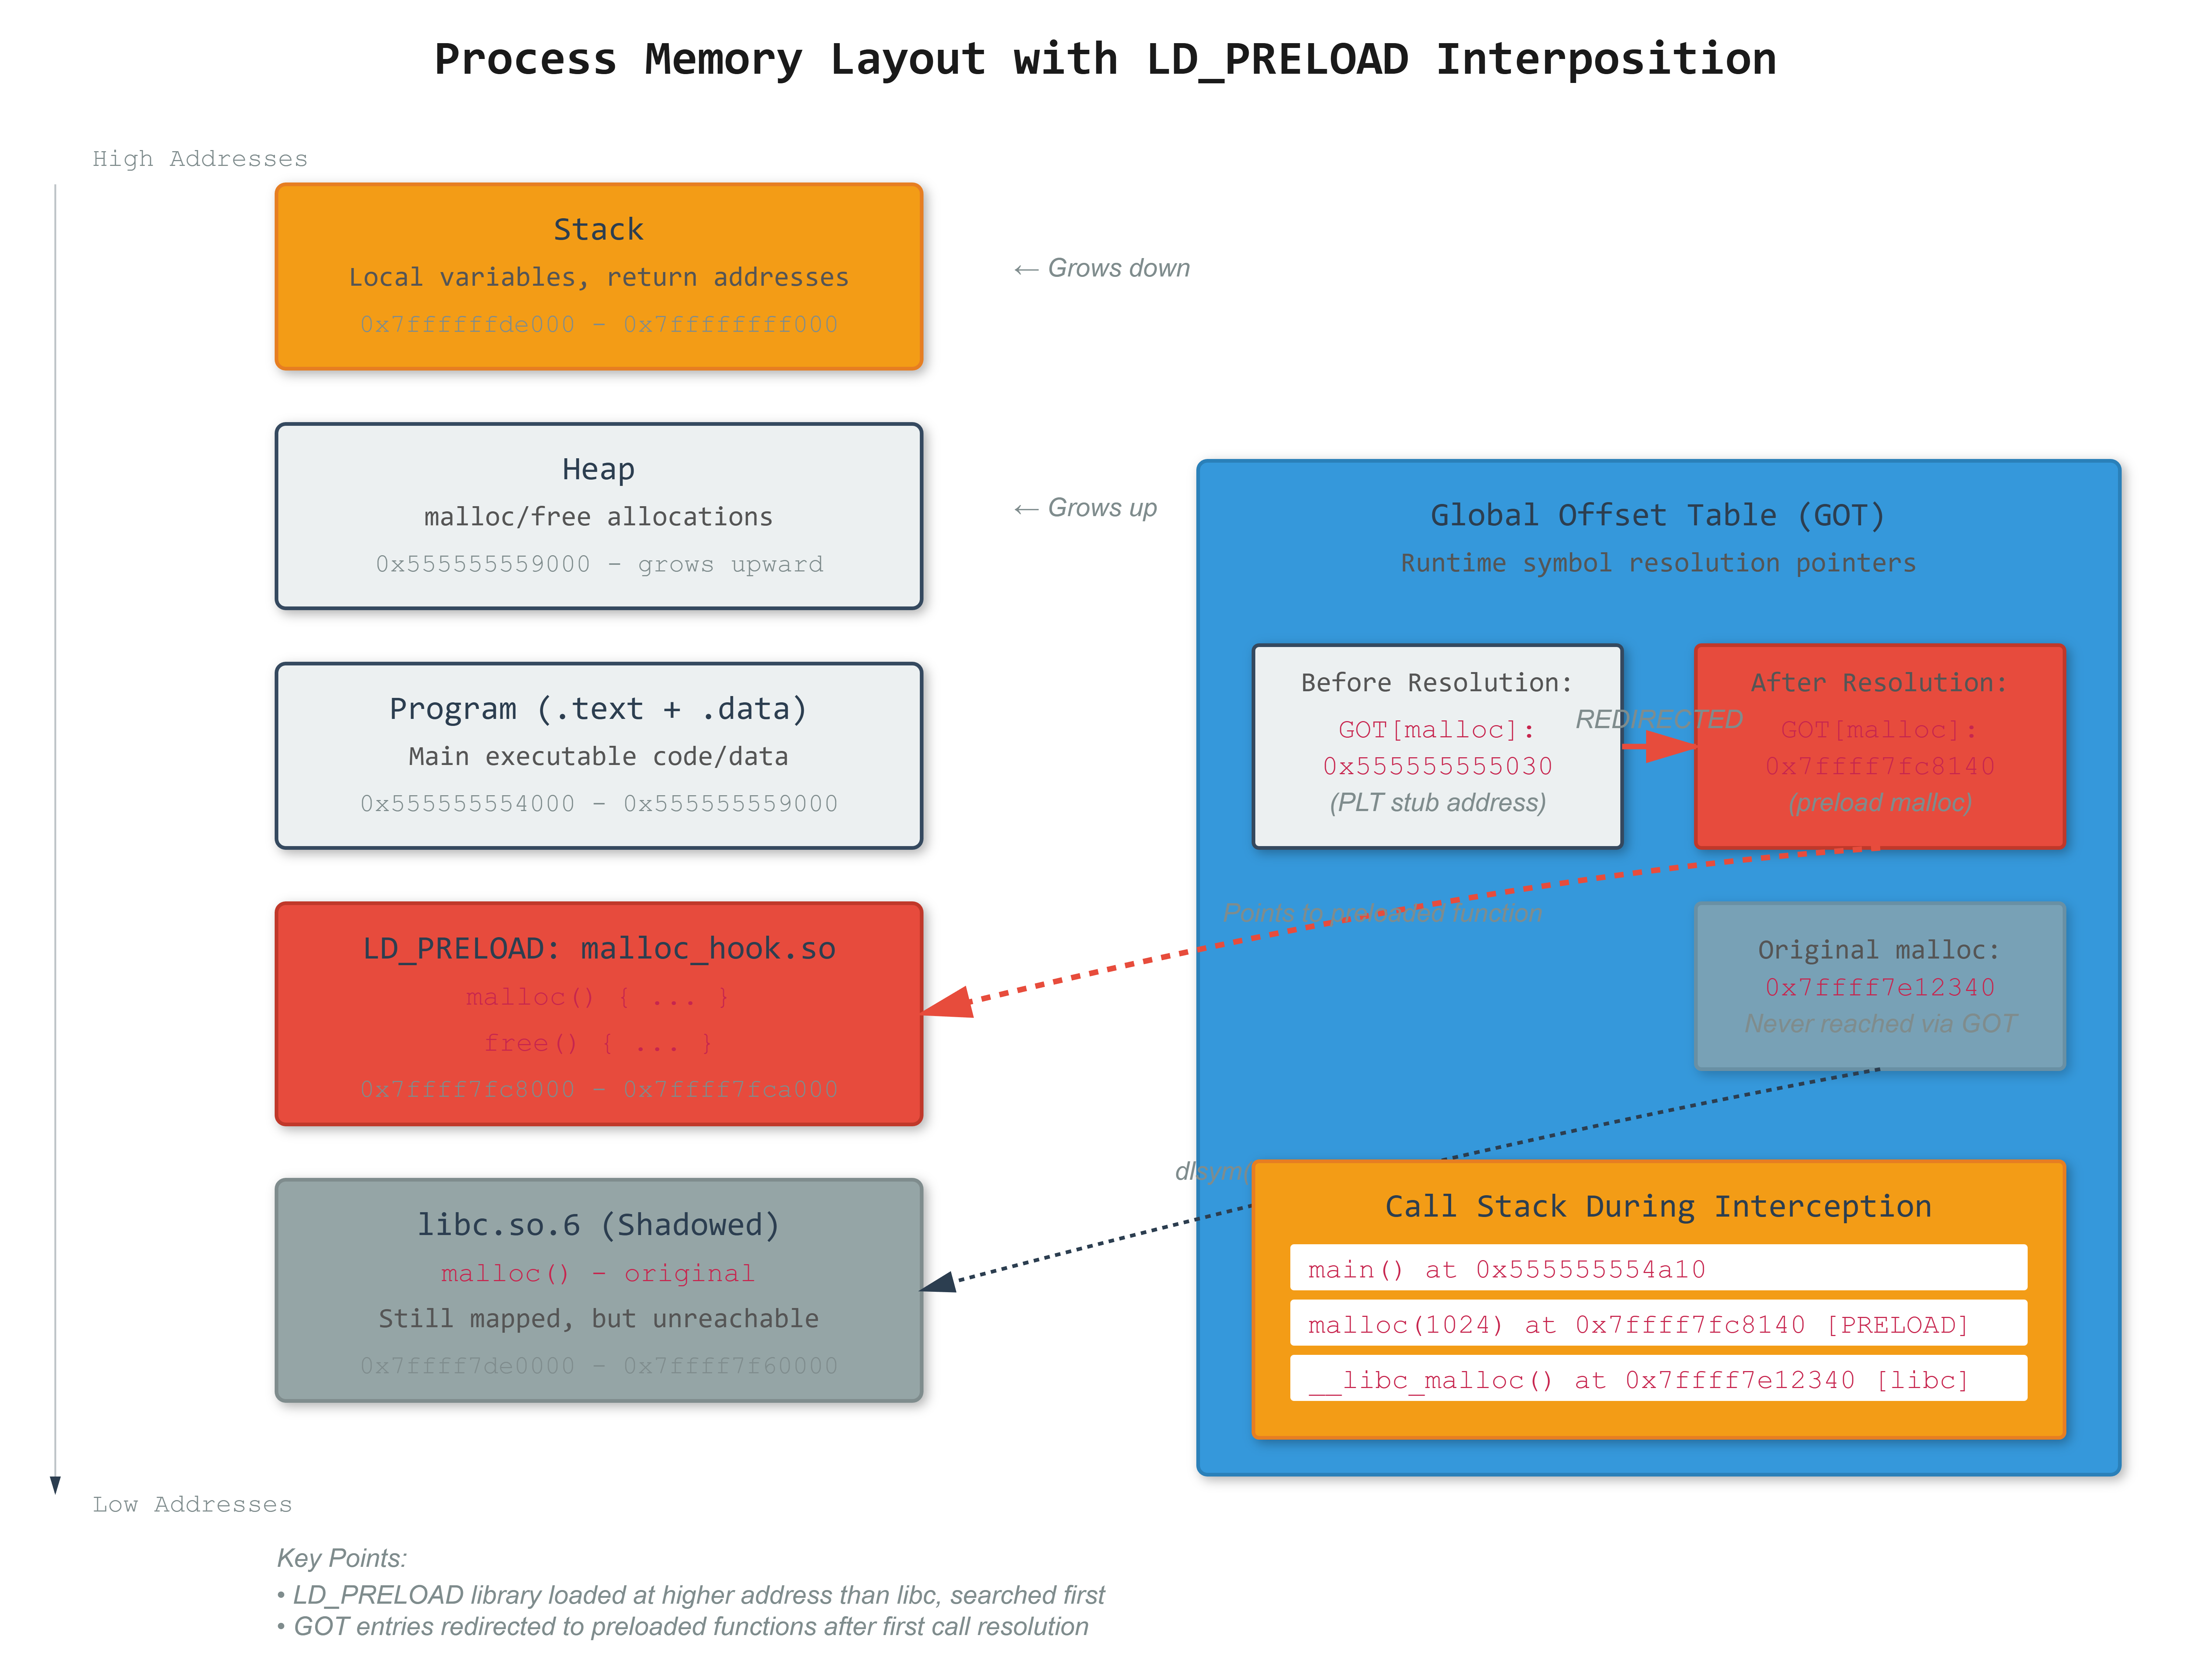
dl_runtime_resolveon first call. After resolution, the GOT entry gets overwritten with the real function address. This lazy binding saves startup time but creates a window where you can inject yourself. WithLD_PRELOAD=/tmp/hook.so, your library loads first, and your malloc shadows libc’s malloc in the symbol search order.
The Symbol Resolution Chain
The dynamic linker searches in a strict order: LD_PRELOAD libraries, then the main executable’s symbols, then DT_NEEDED libraries (from your ELF dependencies), then LD_LIBRARY_PATH, finally system paths. First match wins. This means your preloaded malloc gets called instead of libc’s, every time, even deep in third-party libraries.
Here’s what trips people up: you still need to call the original function. Use dlsym(RTLD_NEXT, "malloc") to get the next symbol in the search chain. Call it wrong and you get infinite recursion when your malloc calls malloc. Call it right and you can log, modify arguments, inject failures, whatever you need.
The Production Reality
We built a malloc tracer that caught allocations never freed by a database driver. Each call logged size, backtrace, and timestamp to a circular buffer. Overhead was 3% compared to valgrind’s 20x slowdown. The trick: minimize your own allocations or you’ll corrupt your tracking by calling the function you’re trying to intercept.
Thread safety matters. If three threads call malloc simultaneously, your wrapper runs concurrently. We used a lock-free ring buffer with atomic operations to avoid deadlock. One engineer tried a mutex and immediately got deadlock when malloc itself needed to allocate memory for pthread structures.
The Dark Side
Privilege escalation via LD_PRELOAD happens when sudoers has env_keep+=LD_PRELOAD. Run sudo env LD_PRELOAD=/tmp/evil.so /bin/ls and your library runs as root. Modern systems use AT_SECURE to clear LD_PRELOAD for setuid binaries, but misconfigurations still happen.
Rootkits use LD_PRELOAD to hide processes. Intercept readdir and filter out specific PIDs. Intercept open and return fake /proc entries. Intercept getpwnam to hide users. All without touching kernel code. Detection requires checking LD_PRELOAD or comparing direct syscalls (which you can’t fake) to library calls.
SELinux and AppArmor can block LD_PRELOAD entirely. Container runtimes can strip it from the environment. Statically linked binaries ignore it completely. Go and Rust programs increasingly bypass libc, making interposition ineffective for their internal operations. Modern security assumes LD_PRELOAD is attacker-controlled.
Building Your Own Interposition Layer
The implementation needs three things: symbol lookup via dlsym, proper calling convention (match the original function exactly), and initialization before any other code runs via __attribute__((constructor)). Your constructor runs before main(), letting you set up tracking structures before the program starts allocating.
Error handling is critical. If dlsym fails to find the original function, abort immediately—continuing will crash. If your logging allocates memory, track recursion depth to avoid infinite loops. If you’re intercepting pthread functions, make your code async-signal-safe or you’ll deadlock during fork.
We use this for testing—inject failures to verify error paths, slow down calls to test timeouts, validate that locks are held by checking thread IDs. For security testing, we intercept SSL functions to capture plaintext or bypass certificate pinning. For performance, we measure lock contention by timing pthread_mutex_lock.
The proof is in LD_DEBUG=symbols: watch the linker search your preloaded library first, find your symbol, bind it in the GOT. Compare with ltrace showing your function name in the call trace. Check /proc/self/maps to see your library loaded before libc. The mechanism is visible if you know where to look.
Interposition is elegant, dangerous, and unavoidable in dynamic linking. It’s how we debug production systems without source code and how attackers compromise systems without kernel exploits. Understanding the PLT/GOT dance makes you better at both sides of that equation.
Hands-On: Build and Test Your Own Malloc Interceptor
Github Link :
https://github.com/sysdr/howtech/tree/main/dynamic_linker_and_symbol_resolution_mechanics/dynamic_linker_and_symbol_resolution_mechanicsLet’s build a working example that demonstrates everything we just discussed. You’ll create an interception library, see it redirect function calls, and prove how the dynamic linker really works.
What We’re Building
Three components that work together:
malloc_hook.so - The interception library that wraps malloc/free
test_program - A simple program that allocates memory
monitor - Shows which libraries are loaded in memory
The beauty here is you can intercept malloc calls from any program without changing its source code or even having access to it.
Creating the Interception Library
First, we write the code that sits between your program and libc. This library has to be careful because it runs very early, before main() even starts.
Create malloc_hook.c:
#define _GNU_SOURCE
#include <stdio.h>
#include <stdlib.h>
#include <dlfcn.h>
#include <pthread.h>
#include <stdatomic.h>
#include <string.h>
// Track statistics using atomic operations for thread safety
static atomic_size_t total_allocations = 0;
static atomic_size_t total_frees = 0;
static atomic_size_t bytes_allocated = 0;
static atomic_size_t current_usage = 0;
static atomic_size_t peak_usage = 0;
// Prevent infinite loops during our own initialization
static __thread int in_hook = 0;
// Pointers to the real malloc/free functions
static void* (*real_malloc)(size_t) = NULL;
static void (*real_free)(void*) = NULL;
static void* (*real_calloc)(size_t, size_t) = NULL;
static pthread_mutex_t log_mutex = PTHREAD_MUTEX_INITIALIZER;
// Temporary buffer for bootstrapping
// We need this because dlsym itself might call malloc
#define TEMP_BUFFER_SIZE 65536
static char temp_buffer[TEMP_BUFFER_SIZE];
static size_t temp_offset = 0;
static void* temp_malloc(size_t size) {
if (temp_offset + size >= TEMP_BUFFER_SIZE) {
return NULL;
}
void* ptr = temp_buffer + temp_offset;
temp_offset += (size + 15) & ~15; // Keep 16-byte aligned
return ptr;
}
// Find the real malloc/free using dlsym
static void init_hooks(void) {
if (real_malloc != NULL) return;
real_malloc = dlsym(RTLD_NEXT, "malloc");
real_free = dlsym(RTLD_NEXT, "free");
real_calloc = dlsym(RTLD_NEXT, "calloc");
if (!real_malloc || !real_free || !real_calloc) {
fprintf(stderr, "ERROR: Failed to find real functions\n");
_exit(1);
}
}
// This runs before main() starts
__attribute__((constructor))
static void malloc_hook_init(void) {
init_hooks();
fprintf(stderr, "\n[HOOK] Malloc interceptor is now active\n");
fprintf(stderr, "[HOOK] All malloc/free calls will be logged\n\n");
}
// This runs after main() finishes
__attribute__((destructor))
static void malloc_hook_fini(void) {
fprintf(stderr, "\n--- Final Memory Statistics ---\n");
fprintf(stderr, "Total allocations: %zu\n", atomic_load(&total_allocations));
fprintf(stderr, "Total frees: %zu\n", atomic_load(&total_frees));
fprintf(stderr, "Bytes allocated: %zu\n", atomic_load(&bytes_allocated));
fprintf(stderr, "Peak memory usage: %zu bytes\n", atomic_load(&peak_usage));
fprintf(stderr, "Memory still in use: %zu bytes\n", atomic_load(¤t_usage));
}
// Our replacement malloc
void* malloc(size_t size) {
// Handle initialization phase
if (real_malloc == NULL) {
init_hooks();
if (real_malloc == NULL) {
return temp_malloc(size);
}
}
// Prevent recursion if we call malloc ourselves
if (in_hook) {
return real_malloc(size);
}
in_hook = 1;
void* ptr = real_malloc(size);
if (ptr != NULL) {
// Update statistics atomically
atomic_fetch_add(&total_allocations, 1);
atomic_fetch_add(&bytes_allocated, size);
size_t new_usage = atomic_fetch_add(¤t_usage, size) + size;
// Track peak usage
size_t current_peak = atomic_load(&peak_usage);
while (new_usage > current_peak) {
if (atomic_compare_exchange_weak(&peak_usage, ¤t_peak, new_usage)) {
break;
}
}
// Log this allocation
pthread_mutex_lock(&log_mutex);
fprintf(stderr, "[MALLOC] %p = malloc(%zu) -> total in use: %zu bytes\n",
ptr, size, new_usage);
pthread_mutex_unlock(&log_mutex);
}
in_hook = 0;
return ptr;
}
// Our replacement free
void free(void* ptr) {
if (ptr == NULL) return;
// Don't free our bootstrap buffer
if (ptr >= (void*)temp_buffer &&
ptr < (void*)(temp_buffer + TEMP_BUFFER_SIZE)) {
return;
}
if (real_free == NULL) {
init_hooks();
if (real_free == NULL) return;
}
if (in_hook) {
real_free(ptr);
return;
}
in_hook = 1;
atomic_fetch_add(&total_frees, 1);
pthread_mutex_lock(&log_mutex);
fprintf(stderr, "[FREE] free(%p)\n", ptr);
pthread_mutex_unlock(&log_mutex);
real_free(ptr);
in_hook = 0;
}
// Handle calloc too
void* calloc(size_t nmemb, size_t size) {
if (real_calloc == NULL) {
init_hooks();
if (real_calloc == NULL) {
void* ptr = temp_malloc(nmemb * size);
if (ptr) memset(ptr, 0, nmemb * size);
return ptr;
}
}
if (in_hook) {
return real_calloc(nmemb, size);
}
in_hook = 1;
void* ptr = real_calloc(nmemb, size);
if (ptr != NULL) {
size_t total_size = nmemb * size;
atomic_fetch_add(&total_allocations, 1);
atomic_fetch_add(&bytes_allocated, total_size);
atomic_fetch_add(¤t_usage, total_size);
pthread_mutex_lock(&log_mutex);
fprintf(stderr, "[CALLOC] %p = calloc(%zu, %zu)\n", ptr, nmemb, size);
pthread_mutex_unlock(&log_mutex);
}
in_hook = 0;
return ptr;
}
Notice a few important things here:
We use
dlsym(RTLD_NEXT, "malloc")to find the real malloc. RTLD_NEXT tells dlsym to skip our library and find the next one in the search order.The
in_hookvariable prevents infinite recursion. If we’re already inside our hook and call fprintf (which might call malloc), we use the real malloc directly.We have a temporary buffer for the bootstrap phase because dlsym itself might allocate memory before we’ve found the real malloc.
The
__attribute__((constructor))makes our init function run before main(). This is when we set up our hooks.
Creating a Test Program
Now let’s write a simple program that allocates memory so we can see the interception working.
Create test_program.c:
#include <stdio.h>
#include <stdlib.h>
#include <string.h>
#include <unistd.h>

int main() {
    printf("\n=== Memory Allocation Test ===\n\n");

    // Allocate some memory
    printf("Allocating 10 blocks of increasing sizes...\n");
    void* ptrs[10];

    for (int i = 0; i < 10; i++) {
        size_t size = (i + 1) * 1024;  // 1KB, 2KB, 3KB...
        ptrs[i] = malloc(size);
        printf("  Allocated %zu bytes\n", size);
        usleep(100000);  // Small delay so you can see each allocation
    }

    printf("\nUsing calloc for zeroed memory...\n");
    void* zeroed = calloc(5, 2048);
    printf("  calloc returned: %p\n", zeroed);

    printf("\nFreeing every other allocation...\n");
    for (int i = 0; i < 10; i += 2) {
        free(ptrs[i]);
        ptrs[i] = NULL;
    }

    printf("\nCleaning up remaining allocations...\n");
    for (int i = 1; i < 10; i += 2) {
        free(ptrs[i]);
    }
    free(zeroed);

    printf("\n=== Test Complete ===\n\n");
    return 0;
}
Building Everything
Create a Makefile to compile both the library and the test program:
CC = gcc
CFLAGS = -Wall -Wextra -Werror -O2 -g
LDFLAGS = -lpthread -ldl

all: malloc_hook.so test_program

malloc_hook.so: malloc_hook.c
	$(CC) $(CFLAGS) -fPIC -shared -o $@ $< $(LDFLAGS)

test_program: test_program.c
	$(CC) $(CFLAGS) -o $@ $<

clean:
	rm -f malloc_hook.so test_program
Now compile:
make
You should see:
gcc -Wall -Wextra -Werror -O2 -g -fPIC -shared -o malloc_hook.so malloc_hook.c -lpthread -ldl
gcc -Wall -Wextra -Werror -O2 -g -o test_program test_program.c
Seeing It Work
Now for the interesting part. Run the program without interception first:
./test_program
You’ll see the program output, but no malloc/free logging. It’s using the system malloc directly.
Now run it with LD_PRELOAD:
LD_PRELOAD=./malloc_hook.so ./test_program
Watch what happens. You’ll see:
[HOOK] Malloc interceptor is now active
[HOOK] All malloc/free calls will be logged

=== Memory Allocation Test ===

Allocating 10 blocks of increasing sizes...
[MALLOC] 0x55555556a2a0 = malloc(1024) -> total in use: 1024 bytes
  Allocated 1024 bytes
[MALLOC] 0x55555556a6b0 = malloc(2048) -> total in use: 3072 bytes
  Allocated 2048 bytes
...
Every single malloc and free call is being intercepted. Your code ran without modification, but the behavior changed completely.
Understanding What Just Happened
Let’s verify the mechanism with some debugging tools.
Check which libraries are loaded:
LD_PRELOAD=./malloc_hook.so ldd ./test_program
You’ll see malloc_hook.so listed before libc. That’s the key to the whole thing.
Watch the dynamic linker resolve symbols:
LD_PRELOAD=./malloc_hook.so LD_DEBUG=symbols ./test_program 2>&1 | grep malloc | head -20
This shows the linker searching for malloc and finding it in your library first.
See library-level calls:
ltrace -e malloc -e free ./test_program 2>&1 | head -20
Without LD_PRELOAD, ltrace shows calls to libc’s malloc. With LD_PRELOAD, it shows calls to your malloc.
The system calls still go to the kernel:
strace -e brk,mmap ./test_program 2>&1 | head -20
This is important: you can fake malloc at the library level, but you can’t fake the actual syscalls (brk, mmap) that malloc uses internally. The kernel still sees the real allocations.
Examining the Binary
Let’s look at how the program actually calls malloc.
Check the PLT (Procedure Linkage Table):
objdump -d test_program | grep -A5 "malloc@plt"
You’ll see something like:
0000000000001050 <malloc@plt>:
    1050:   ff 25 ca 2f 00 00       jmp    *0x2fca(%rip)
    1056:   68 00 00 00 00          push   $0x0
    105b:   e9 e0 ff ff ff          jmp    1040 <_init+0x20>
That jmp *0x2fca(%rip) is jumping to an address stored in the GOT.
Check the relocation entries:
readelf -r test_program | grep malloc
You’ll see a JUMP_SLOT relocation for malloc. This is what the dynamic linker fills in at runtime.
Real-World Applications
Now that you’ve built it, here’s how this gets used in practice:
Debugging Memory Leaks
Production system leaking memory, can’t restart it, can’t modify the code. Inject your malloc tracker with LD_PRELOAD, let it run for a few minutes, check which allocations never got freed.
Testing Error Paths
Modify your malloc to randomly return NULL sometimes. Does your application handle allocation failures correctly? Most code never tests this because malloc rarely fails in development.
Performance Analysis
Track which functions allocate the most memory, find hotspots, see allocation patterns over time. All without instrumenting the source code.
Security Testing
Intercept SSL/TLS functions to see plaintext data. Test if an app validates certificates properly by returning fake validation results. Find vulnerabilities in how programs handle untrusted input.
The Security Side
Everything we just built can be used for good or bad. The same technique that helps you debug at 2 AM helps attackers compromise systems.
A rootkit could intercept:
readdir()to hide filesstat()to fake file sizesgetpwnam()to hide user accountsaccept()to intercept network connections
The defense is that LD_PRELOAD doesn’t work on setuid binaries (the kernel blocks it for security) and you can detect it by checking the environment or comparing library calls to direct syscalls.
Common Mistakes to Avoid
From watching people learn this, here are the problems that come up:
Infinite Recursion: If your malloc calls fprintf which calls malloc, you’re stuck. That’s why we use the in_hook flag.
Forgetting Thread Safety: Multiple threads can call your hook simultaneously. Use atomics or locks properly or you’ll corrupt your data structures.
Memory in the Hook: If your tracking code allocates memory, you’re calling malloc from malloc. Either use the original malloc directly (via the in_hook flag) or use a static buffer.
Initialization Order: dlsym might call malloc before you’ve found the real malloc. That’s why we have the temporary buffer.
Not Checking dlsym Return: If dlsym returns NULL, don’t just continue. Your program will crash when you try to call a NULL pointer.
Going Further
Try modifying the code to track:
Peak memory usage over time
Which allocation sizes are most common
Call stacks for each allocation (use backtrace)
Allocation lifetimes (time between malloc and free)
Or intercept other functions:
pthread_mutex_lock to find contention
open/close to track file descriptors
socket/connect to monitor network activity
The mechanism is the same for any library function. Just make sure you call the real function eventually (unless you’re completely replacing the behavior).
Cleanup
When you’re done experimenting:
make clean
rm -f malloc_hook.c test_program.c Makefile
Summary
We’ve seen how LD_PRELOAD works from both the theoretical side and by building a working implementation. The key points:
The dynamic linker searches libraries in order, and LD_PRELOAD comes first. This lets you replace any library function without modifying the program. Your replacement function uses dlsym(RTLD_NEXT) to find and call the original. This works for debugging, testing, monitoring, and unfortunately also for attacks.
The PLT/GOT mechanism makes runtime interposition possible. Every external function call goes through an indirection that can be hijacked. Modern systems have protections (AT_SECURE for setuid, SELinux policies, container isolation), but the fundamental mechanism remains.
When you need to debug a production system without source code, understand why a vendor library behaves oddly, or test error paths that are hard to trigger naturally, LD_PRELOAD gives you surgical control over program behavior. Just remember that same power works both ways.
Really like how you share both the struggles and the wins it makes the advice feel real.