Profiling User-Space Applications with perf and DWARF Debug Info
You’re staring at a latency spike at 2 AM.
perf reportshows 99% of samples labeled “[unknown]”. Your production binaries are stripped, built with-fomit-frame-pointerfor that mythical 2% performance gain. Now you’re blind, guessing where the CPU time went. This is why understanding perf’s sampling mechanisms and DWARF debug information isn’t academic—it’s the difference between finding your bottleneck in 10 minutes versus guessing for 3 hours.
How perf Actually Samples Your Code
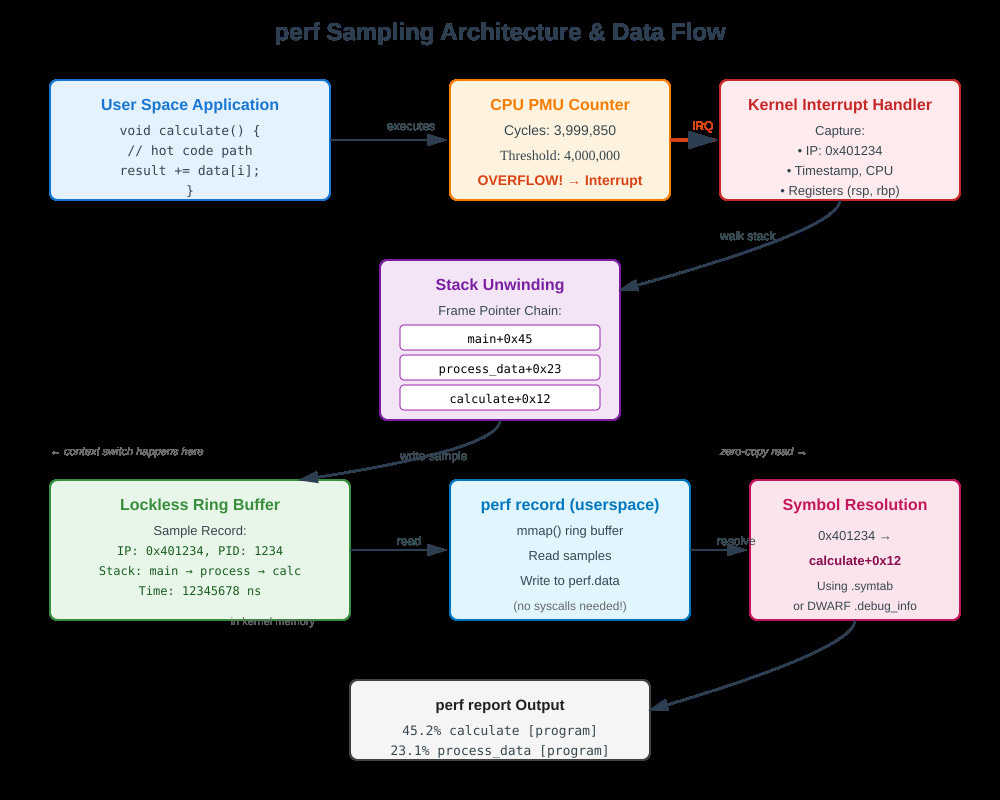
When you run perf record -g, your CPU’s Performance Monitoring Unit (PMU) counts events—cycles, instructions, cache misses. After N events (default: 4000 per second), the PMU triggers an interrupt. The kernel’s perf subsystem captures the instruction pointer, registers, and crucially, walks the stack to build a call chain. This sample lands in a lockless ring buffer that perf record reads from user space.