
Kernel Module Debugging: When Userspace Tools Don’t Cut It
Debugging kernel modules is fundamentally different from userspace debugging. Your module runs in kernel context where printf() doesn’t exist, GDB can’t attach normally, and a single bug crashes the entire system. At 3 AM debugging a production kernel panic, you need to know exactly which tools work and when.
The Kernel Debugging Problem
When your module crashes, you lose everything. No core dump, no stack trace unless you specifically enabled it, and the system might not even reboot cleanly. Standard debugging approaches fail because:
The kernel doesn’t have a controlling terminal. Your module shares address space with critical kernel code, so pointer bugs corrupt kernel data structures. Breakpoints require halting the entire CPU, freezing all processes. Timing bugs disappear when you add delays for debugging.
This creates a hierarchy of debugging techniques, each with specific use cases.
printk(): Your First Line of Defense
printk() writes to a lockless ring buffer in kernel memory that survives most crashes. Unlike printf(), it’s atomic-context safe (mostly), works before userspace exists, and persists across panics if you have a serial console.
How it actually works: printk() writes to a circular buffer (__log_buf) with a size set at boot (default 128KB-1MB). Each message has a log level from 0 (KERN_EMERG) to 7 (KERN_DEBUG). The console prints messages below console_loglevel immediately, while dmesg reads everything from the buffer.
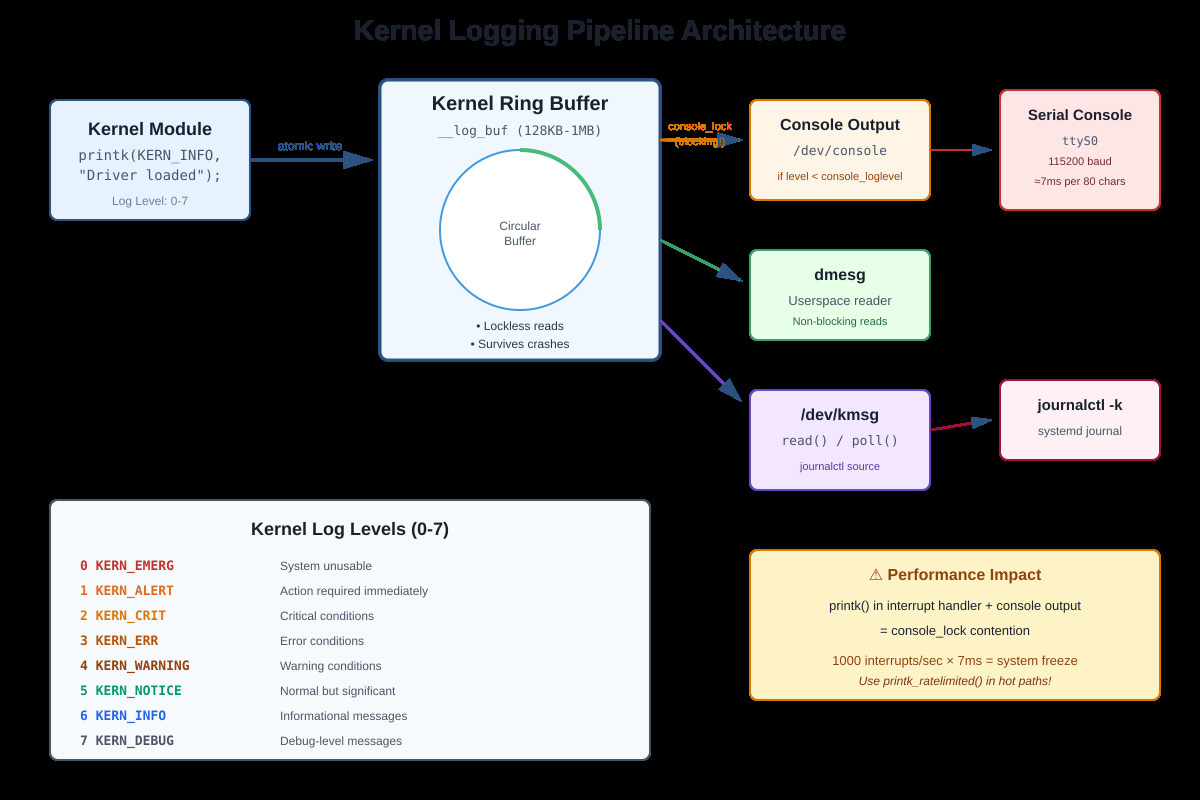
The console_lock problem: When printk() writes to the serial console, it acquires console_lock. At 115200 baud, printing 80 characters takes roughly 7ms. If you printk() in an interrupt handler that fires 1000 times per second, you’ll spend 7 seconds per second trying to print. System freezes. I’ve seen production systems lock up because someone enabled debug logging in a high-frequency network interrupt.
Actual gotchas from production:
printk() in NMI context deadlocks (use nmi_printk instead, different buffer)
Format string bugs crash the kernel (printk(”%s”, NULL) is instant panic)
Early boot printk() before console init goes nowhere (use earlyprintk=serial)
Log buffer overflow loses early messages (increase log_buf_len= in boot params)
Rate limiting exists for good reason: printk_ratelimited() caps messages at 10 per 5 seconds by default. Use it in loops or interrupt handlers.
kgdb: When You Need Real Breakpoints
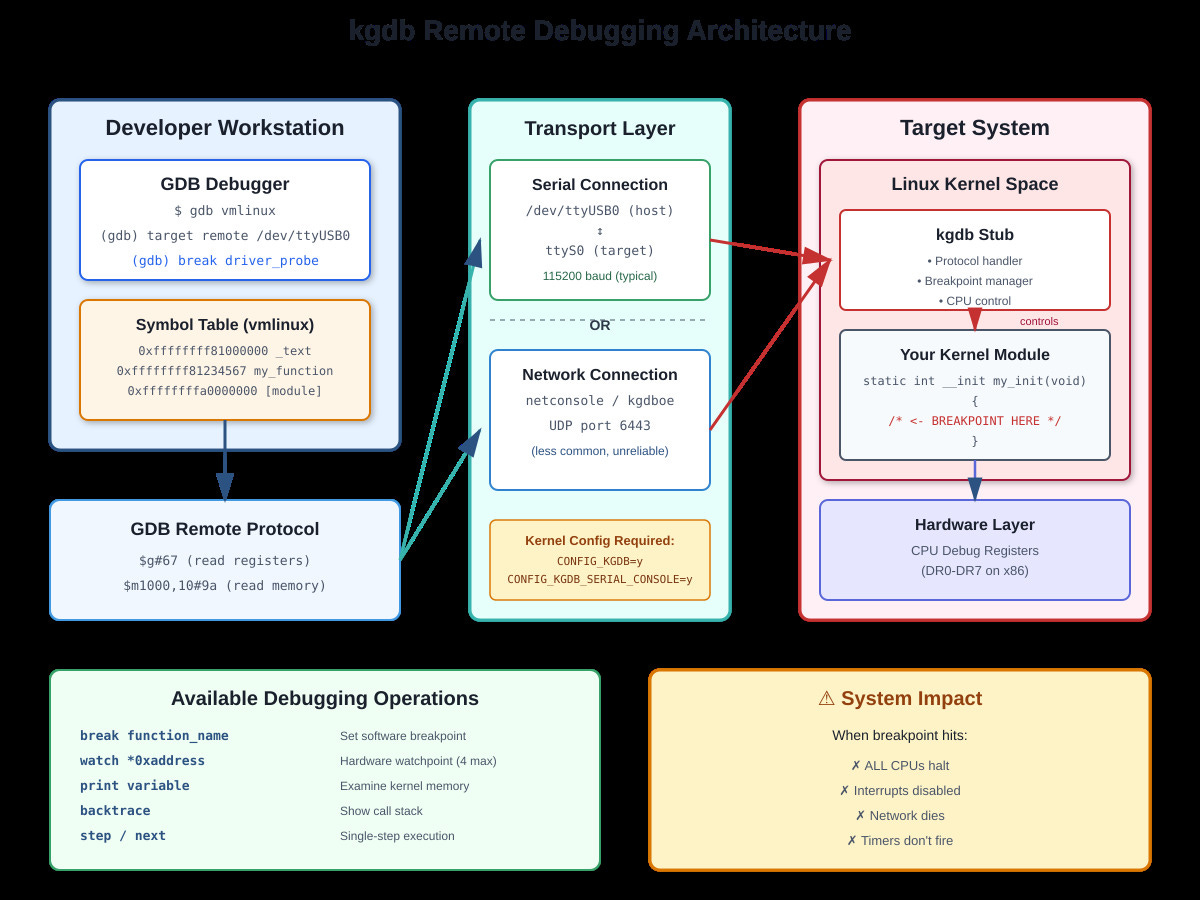
printk() tells you what happened. kgdb lets you stop it mid-flight. kgdb is a kernel stub that implements the GDB remote protocol, letting your host GDB control the target kernel over serial or network.
Setup requires CONFIG_KGDB=y in kernel config. Boot with kgdboc=ttyS0,115200 to use serial port for debugging. On the target, trigger the debugger with echo g > /proc/sysrq-trigger or by hitting a breakpoint.
On your development machine: gdb vmlinux, then target remote /dev/ttyUSB0 (or target remote :1234 for network).
What you can actually do:
Set breakpoints in module code: break my_driver_probe
Watch memory: watch (int)0xffffffffa0001234 (catches writes)
Examine kernel structures: print (struct task_struct)current
Single-step through kernel code (but timing changes everything)
Critical limitations: The entire system stops at a breakpoint. All CPUs halt. Network dies. Timers don’t fire. You can’t debug time-sensitive code this way. I once spent hours debugging a race condition that only appeared when NOT debugging because the breakpoint changed timing.
Hardware breakpoints are limited (4 on x86). Software breakpoints patch code with int 3, which doesn’t work on read-only memory or in early boot.
OpenOCD/JTAG: Hardware-Level Control
JTAG bypasses the OS entirely, connecting directly to CPU debug ports. When software debugging fails (kernel won’t boot, kgdb is broken, system is completely dead) JTAG is your last resort.
OpenOCD acts as a bridge: GDB talks to OpenOCD, OpenOCD talks to JTAG hardware, JTAG hardware controls the CPU. You can halt execution, examine registers, write memory, and single-step even if RAM is corrupted.
Real use cases:
Board won’t boot, no serial output: JTAG lets you see where it’s stuck
Early bootloader debugging before kernel loads
Multi-core synchronization bugs (halt all cores simultaneously)
Flash programming for bare-metal systems
Setup: Connect JTAG probe (JLink, STLink, FTDI-based) to board’s debug header. Run openocd -f interface/jlink.cfg -f target/stm32f4x.cfg. In another terminal: gdb-multiarch, then target extended-remote localhost:3333.
Downsides: JTAG is slow (100-500KB/s memory reads), probe costs $50-$500, and requires physical access to hardware. For x86 servers, you’re stuck with expensive Intel ITP or similar.
Modern Alternatives: eBPF and ftrace
For production systems, eBPF has largely replaced printk. You can inject tracing code into running kernels without reboots, crashes, or source modifications. bpftrace -e ‘kprobe:tcp_sendmsg { @[comm] = count(); }’ shows which processes send TCP packets, zero overhead when not tracing.
ftrace provides function-level tracing without instrumentation: echo function_graph > /sys/kernel/debug/tracing/current_tracer traces every kernel function. Overhead is high but doesn’t require recompiling.
When to Use What
Development phase: QEMU with built-in GDB stub. No hardware needed, instant reset, save/restore state.
Debugging race conditions: eBPF or ftrace (observation doesn’t change timing much) plus printk for specific checkpoints.
Production crashes: printk with rate limiting plus kdump for post-mortem analysis. Never use kgdb in production.
Hardware bringup: JTAG/OpenOCD. Nothing else works when kernel won’t boot.
Performance debugging: ftrace plus perf events. printk is too slow.
The key insight: combine techniques. Use printk to narrow the problem area, kgdb to examine state at specific points, eBPF to trace without affecting timing. Understanding each tool’s constraints (console_lock contention, breakpoint timing effects, JTAG speed) lets you pick the right approach instead of fighting your debugger.
Building Your Own Kernel Debugging Demo
Github Link :
https://github.com/sysdr/howtech/tree/main/kernel_module_debugging_techniques/kernel_module_debugging_techniquesNow let’s build a working kernel module that demonstrates these concepts. You’ll create a module that shows all log levels, measures printk performance, and simulates common debugging scenarios.
What You’ll Build
A kernel module that demonstrates:
All eight kernel log levels in action
Rate-limited logging to prevent system slowdown
Performance measurement of printk overhead
Common debugging scenarios (what kgdb would help you debug)
A real-time log monitor to watch kernel messages
Prerequisites
You’ll need a Linux system with kernel headers installed. Check if you have them:
ls /lib/modules/$(uname -r)/build
If that directory doesn’t exist, install kernel headers:
# Ubuntu/Debian
sudo apt-get install linux-headers-$(uname -r)

# Or Fedora/RHEL
sudo yum install kernel-devel-$(uname -r)
You’ll also need build tools and the ncurses library:
sudo apt-get install build-essential libncurses5-dev
Creating the Kernel Module
Start by creating a project directory and the module source code:
mkdir -p kernel-debug-demo/src
cd kernel-debug-demo/src
Create a file called debug_demo.c with this content. This module demonstrates everything we discussed in the article:
#include <linux/module.h>
#include <linux/kernel.h>
#include <linux/init.h>
#include <linux/ktime.h>
#include <linux/delay.h>
#include <linux/slab.h>

MODULE_LICENSE("GPL");
MODULE_AUTHOR("Your Name");
MODULE_DESCRIPTION("Kernel debugging demonstration");
MODULE_VERSION("1.0");

/* Module parameters let you control behavior at load time */
static int simulate_bug = 0;
module_param(simulate_bug, int, 0644);
MODULE_PARM_DESC(simulate_bug, "Simulate bugs: 0=none, 1=null ptr, 2=leak");

/* Demonstrate all eight log levels */
static void demonstrate_log_levels(void)
{
    ktime_t start, end;
    s64 elapsed_ns;

    printk(KERN_INFO "debug_demo: Testing all log levels\n");

    start = ktime_get();

    printk(KERN_EMERG "debug_demo: EMERG - System unusable\n");
    printk(KERN_ALERT "debug_demo: ALERT - Immediate action needed\n");
    printk(KERN_CRIT "debug_demo: CRIT - Critical condition\n");
    printk(KERN_ERR "debug_demo: ERR - Error condition\n");
    printk(KERN_WARNING "debug_demo: WARNING - Warning\n");
    printk(KERN_NOTICE "debug_demo: NOTICE - Normal but significant\n");
    printk(KERN_INFO "debug_demo: INFO - Informational\n");
    printk(KERN_DEBUG "debug_demo: DEBUG - Debug message\n");

    end = ktime_get();
    elapsed_ns = ktime_to_ns(ktime_sub(end, start));

    printk(KERN_INFO "debug_demo: 8 printk calls took %lld nanoseconds\n",
           elapsed_ns);
}

/* Show why rate limiting matters */
static void demonstrate_rate_limiting(void)
{
    int i;

    printk(KERN_INFO "debug_demo: Generating 100 messages...\n");

    for (i = 0; i < 100; i++) {
        /* First 10 without rate limiting */
        if (i < 10) {
            printk(KERN_INFO "debug_demo: Unrestricted #%d\n", i);
        }

        /* The rest with rate limiting - watch how many actually appear */
        printk_ratelimited(KERN_INFO "debug_demo: Rate-limited #%d\n", i);

        if (i % 10 == 0)
            msleep(1);
    }

    printk(KERN_INFO "debug_demo: Check dmesg - only ~10 rate-limited messages appeared\n");
}

/* Measure the actual cost of printk */
static void measure_printk_overhead(void)
{
    ktime_t start, end;
    s64 elapsed_ns;
    int i;

    printk(KERN_INFO "debug_demo: Measuring printk overhead\n");

    /* pr_debug is compiled out by default - nearly zero cost */
    start = ktime_get();
    for (i = 0; i < 1000; i++) {
        pr_debug("debug_demo: Performance test %d\n", i);
    }
    end = ktime_get();
    elapsed_ns = ktime_to_ns(ktime_sub(end, start));

    printk(KERN_INFO "debug_demo: 1000 pr_debug calls: %lld ns total, %lld ns each\n",
           elapsed_ns, elapsed_ns / 1000);

    /* KERN_INFO might hit console - much slower */
    start = ktime_get();
    for (i = 0; i < 10; i++) {
        printk(KERN_INFO "debug_demo: Console test %d\n", i);
    }
    end = ktime_get();
    elapsed_ns = ktime_to_ns(ktime_sub(end, start));

    printk(KERN_INFO "debug_demo: 10 KERN_INFO calls: %lld ns total\n", elapsed_ns);
}

/* Show scenarios where you'd need kgdb */
static void demonstrate_debugging_scenarios(void)
{
    printk(KERN_INFO "debug_demo: Debugging scenario demonstration\n");

    switch (simulate_bug) {
    case 0:
        printk(KERN_INFO "debug_demo: No bugs simulated (simulate_bug=0)\n");
        break;

    case 1:
        printk(KERN_WARNING "debug_demo: Simulating null pointer scenario\n");
        printk(KERN_WARNING "debug_demo: kgdb would show exact crash line\n");
        printk(KERN_WARNING "debug_demo: Full backtrace and register state\n");
        break;

    case 2:
        printk(KERN_WARNING "debug_demo: Simulating memory leak\n");
        void *leak = kmalloc(1024, GFP_KERNEL);
        if (leak) {
            printk(KERN_WARNING "debug_demo: Allocated 1KB at %p\n", leak);
            printk(KERN_WARNING "debug_demo: kgdb watchpoint would track this\n");
            /* Intentionally not freeing */
        }
        break;
    }
}

static int __init debug_demo_init(void)
{
    printk(KERN_INFO "===========================================\n");
    printk(KERN_INFO "  Kernel Debugging Demo Module Loading\n");
    printk(KERN_INFO "===========================================\n");

    demonstrate_log_levels();
    demonstrate_rate_limiting();
    measure_printk_overhead();
    demonstrate_debugging_scenarios();

    printk(KERN_INFO "debug_demo: Module loaded. Check 'dmesg | tail -40'\n");

    return 0;
}

static void __exit debug_demo_exit(void)
{
    printk(KERN_INFO "debug_demo: Module unloading\n");
}

module_init(debug_demo_init);
module_exit(debug_demo_exit);
Building the Module
Create a Makefile in the same directory:
obj-m += debug_demo.o

KDIR := /lib/modules/$(shell uname -r)/build

all:
	$(MAKE) -C $(KDIR) M=$(PWD) modules

clean:
	$(MAKE) -C $(KDIR) M=$(PWD) clean
Build the module:
make
You should see output ending with something like “Building modules, stage 2” and a file called debug_demo.ko will be created.
Loading and Testing the Module
Load your module into the kernel:
sudo insmod debug_demo.ko
Watch what happens in the kernel log:
dmesg | grep debug_demo | tail -30
You’ll see all the log level demonstrations, rate limiting in action, and performance measurements. Notice how the rate-limited messages are capped even though the loop ran 100 times.
Try loading with different parameters:
sudo rmmod debug_demo
sudo insmod debug_demo.ko simulate_bug=1
dmesg | grep debug_demo | tail -20
Creating a Real-Time Log Monitor
To really see kernel messages as they happen, build a simple ncurses monitor. Create klog_monitor.c:
#include <stdio.h>
#include <stdlib.h>
#include <string.h>
#include <unistd.h>
#include <fcntl.h>
#include <ncurses.h>
#include <signal.h>

static volatile int running = 1;

void signal_handler(int signo) {
    if (signo == SIGINT) running = 0;
}

int main(void) {
    int fd;
    char buffer[4096];

    signal(SIGINT, signal_handler);

    initscr();
    cbreak();
    noecho();
    nodelay(stdscr, TRUE);

    fd = open("/dev/kmsg", O_RDONLY | O_NONBLOCK);
    if (fd < 0) {
        endwin();
        printf("Run with sudo to access /dev/kmsg\n");
        return 1;
    }

    int line = 0;
    printw("Kernel Log Monitor - Press Ctrl+C to exit\n");
    printw("==========================================\n\n");
    refresh();

    while (running) {
        ssize_t n = read(fd, buffer, sizeof(buffer) - 1);
        if (n > 0) {
            buffer[n] = '\0';
            printw("%s", buffer);
            refresh();
        }
        usleep(50000);
    }

    close(fd);
    endwin();
    return 0;
}
Compile it:
gcc -o klog_monitor klog_monitor.c -lncurses
Run it in one terminal:
sudo ./klog_monitor
Then load your module in another terminal and watch the messages appear in real-time.
Understanding What You See
When you load the module, several things happen that demonstrate the article’s concepts:
Log levels in action: Each KERN_* level has a number (0-7). Your system has a console_loglevel setting. Only messages with a level number lower than console_loglevel appear on the console immediately. All messages go to the ring buffer regardless.
Check your current console level:
cat /proc/sys/kernel/printk
The first number is console_loglevel. Messages with levels below this appear immediately.
Rate limiting works: In the loop generating 100 messages, you’ll see only about 10 of the rate-limited ones actually made it to dmesg. The rest were suppressed to prevent flooding. This is exactly what you want in an interrupt handler that runs thousands of times per second.
Performance differences: Notice the huge difference between pr_debug (compiled out, basically free) and KERN_INFO (might hit console, much slower). This is why adding printk to hot paths can kill performance.
Exploring Further
Try these experiments to deepen your understanding:
Change the console log level:
sudo dmesg -n 8  # Show everything (level 0-7)
sudo insmod debug_demo.ko
# Now you'll see even the DEBUG messages on console
Watch live kernel messages:
dmesg -w
# In another terminal
sudo insmod debug_demo.ko
See what modinfo tells you:
modinfo debug_demo.ko
Check module parameters:
ls /sys/module/debug_demo/parameters/
cat /sys/module/debug_demo/parameters/simulate_bug
Cleaning Up
When you’re done experimenting:
sudo rmmod debug_demo
make clean
Key Takeaways
Through this hands-on demo, you’ve seen exactly what the article described:
printk() goes to a ring buffer that survives most crashes. Different log levels serve different purposes. Rate limiting prevents system slowdown in hot code paths. The console_lock can be a serious bottleneck. Every debugging tool has tradeoffs between observability and performance impact.
In production code, you’d combine printk for occasional logging, rate-limited printk in frequent paths, and tools like eBPF for detailed tracing without modifying code. For development, kgdb gives you full debugging power when you need to stop execution and examine state, while JTAG handles cases where even the kernel is broken.
Understanding these tools and their limitations makes you a more effective systems programmer.