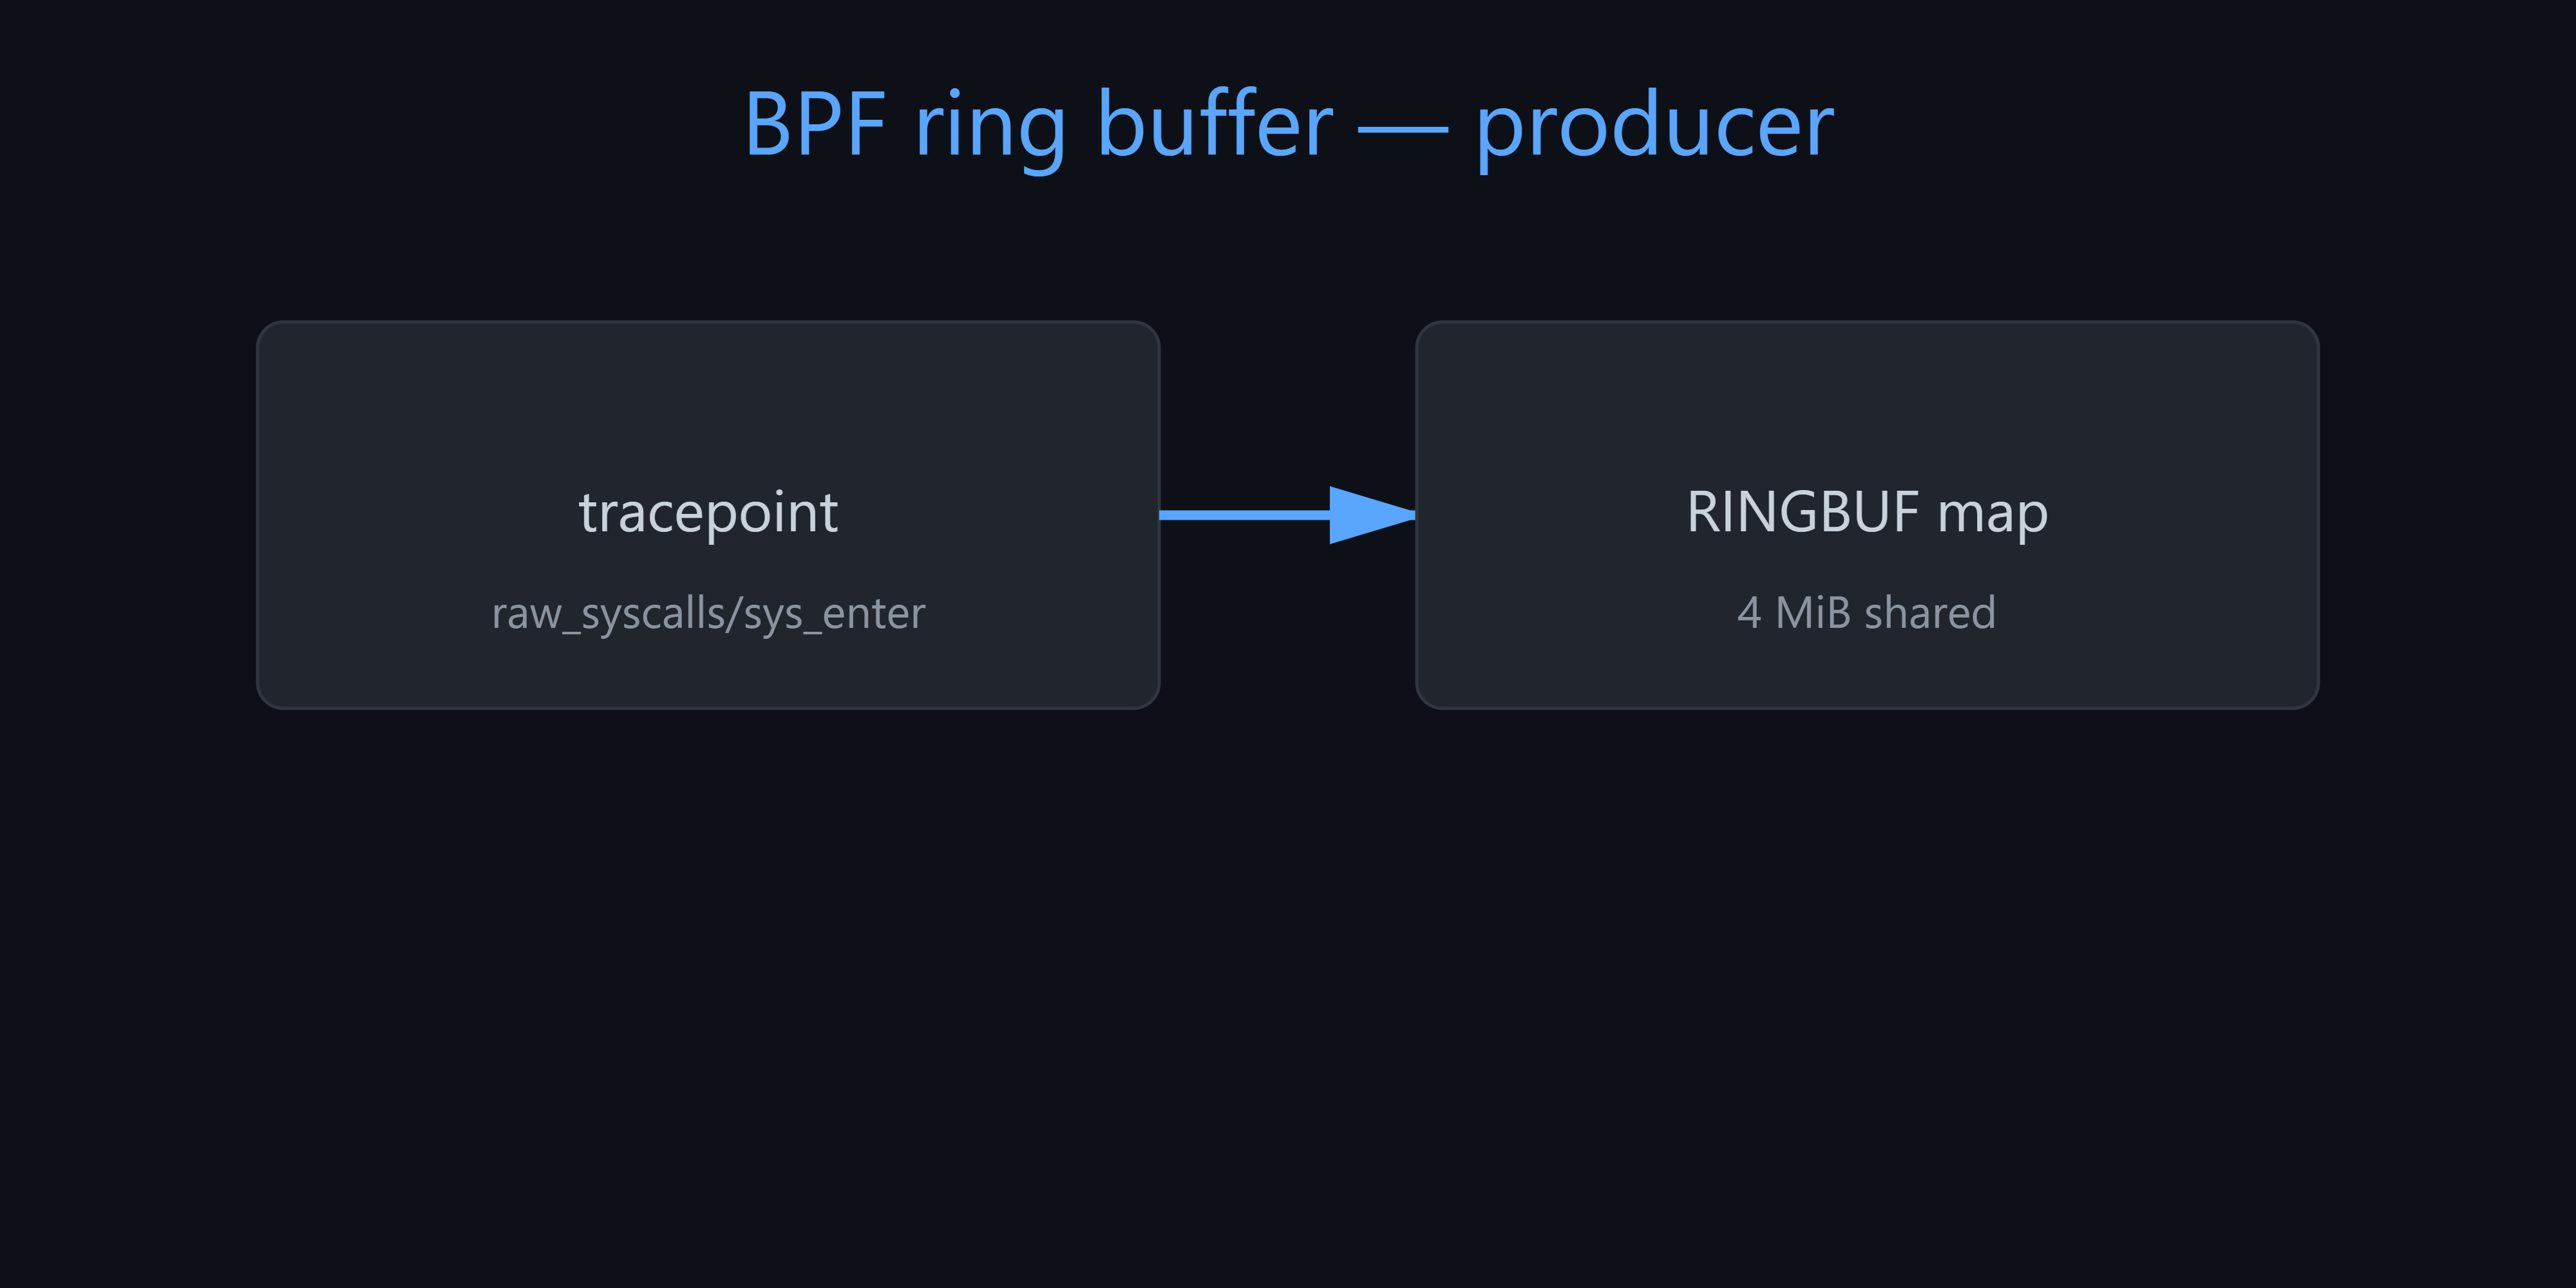
Implementing Custom Metrics Gathering Using BPF Ring Buffers
Before
BPF_MAP_TYPE_RINGBUF, you streamed events from kernel to userspace throughperf_event_array— one ring buffer per CPU, each consuming its full allocation whether that CPU was idle or saturated. On a 96-core machine with 4MB per-CPU buffers, that is 384MB of pinned kernel memory before your tracer logs a single event. Worse, events from different CPUs arrived out of timestamp order, so any analysis requiring causality needed a reorder pass in userspace. And if your userspace consumer stalled for even a millisecond, a busy CPU could silently overwrite the oldest records with no indication that data was lost.
BPF_MAP_TYPE_RINGBUFlanded in Linux 5.8. One shared buffer, all CPUs, in-order delivery by design, and a proper drop counter you can actually observe.
The Memory Layout
The kernel-side
bpf_ringbufobject has three layers: a consumer meta-page, a producer meta-page, and a power-of-2 array of data pages. Each meta-page holds a single 64-bit position counter — that is the entirety of the synchronization state. No spinlocks. No mutexes protecting the positions. Just two counters and an atomic compare-and-swap.When you create the map, the kernel mmaps this structure into a file descriptor you can poll. The consumer page is mapped read-only; your userspace process reads its own position directly from the shared mapping without any syscall. The data pages are mapped twice in the virtual address space — a classic ring buffer trick that lets
ring_buffer__poll()read events spanning the physical wrap boundary without copying. The only kernel entry on the hot path is the initialepoll_wait.