
Garbage Collection (GC) Pauses: A "stop-the-world" GC pause in a critical service
Master Guide: Taming Garbage Collection Pauses in Production
The Silent Service Killer
Your payment processing service handles 50,000 transactions per second flawlessly for months. Then, at 2 AM during Black Friday traffic, a single 8-second garbage collection pause freezes your entire checkout flow. Upstream services timeout, circuit breakers trip, and within minutes, your entire distributed system cascades into failure. This scenario has taken down giants like Netflix, Uber, and countless fintech platforms.
Today, we're building a real-time GC monitoring and mitigation system that detects, prevents, and gracefully handles garbage collection pauses before they become catastrophic failures.
The Hidden Mechanics of GC Chaos
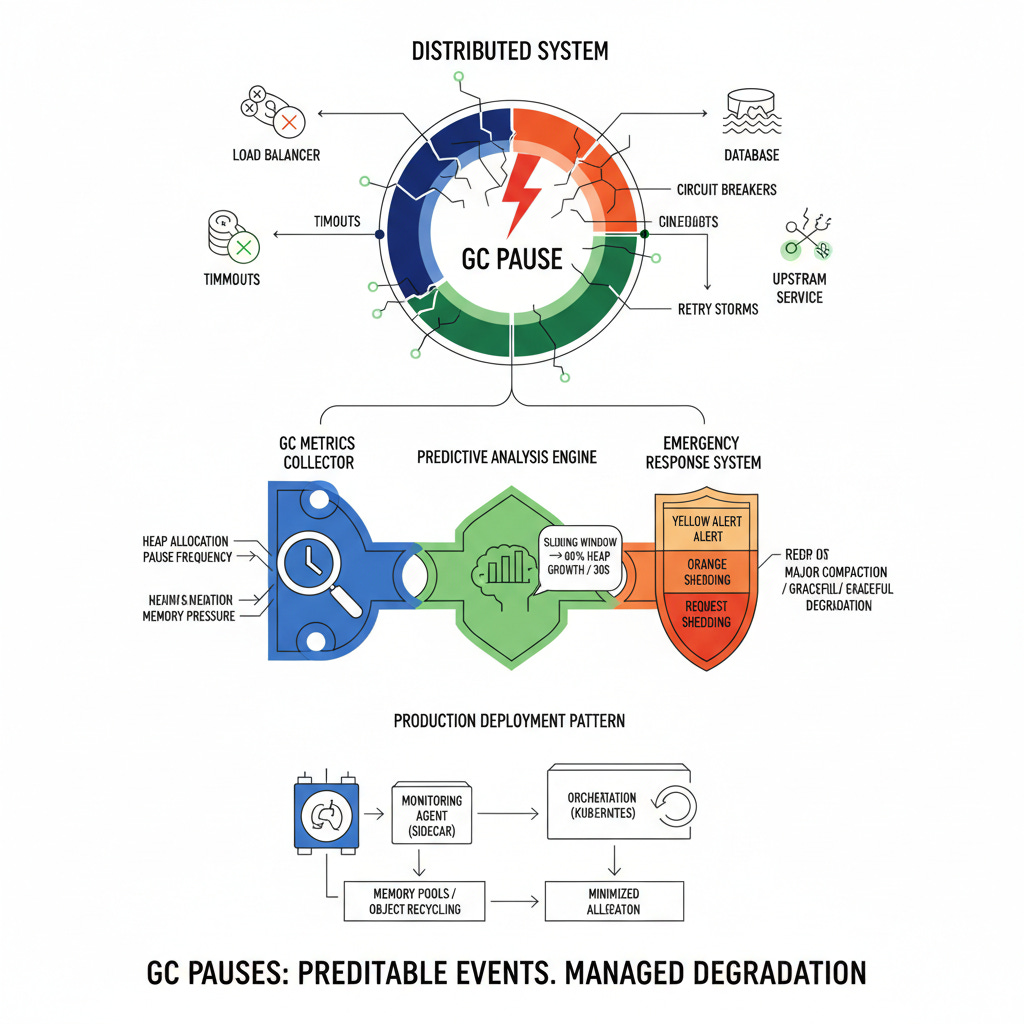
Garbage collection pauses don't just freeze your application—they create a domino effect through your entire infrastructure. When your service stops responding for even 2-3 seconds, load balancers mark it as unhealthy, upstream services exhaust their connection pools, and downstream databases get overwhelmed by retry storms.
The core problem isn't the GC itself—it's the lack of proactive detection and graceful degradation. Most teams only discover GC issues during post-mortems, analyzing heap dumps after millions in revenue have already been lost.
Our solution monitors GC metrics in real-time, implements circuit breaker patterns, and automatically triggers emergency heap compaction before critical thresholds are reached. We'll use Go for its predictable GC behavior and Java integration points for enterprises running JVM-based services.
Implementation Architecture
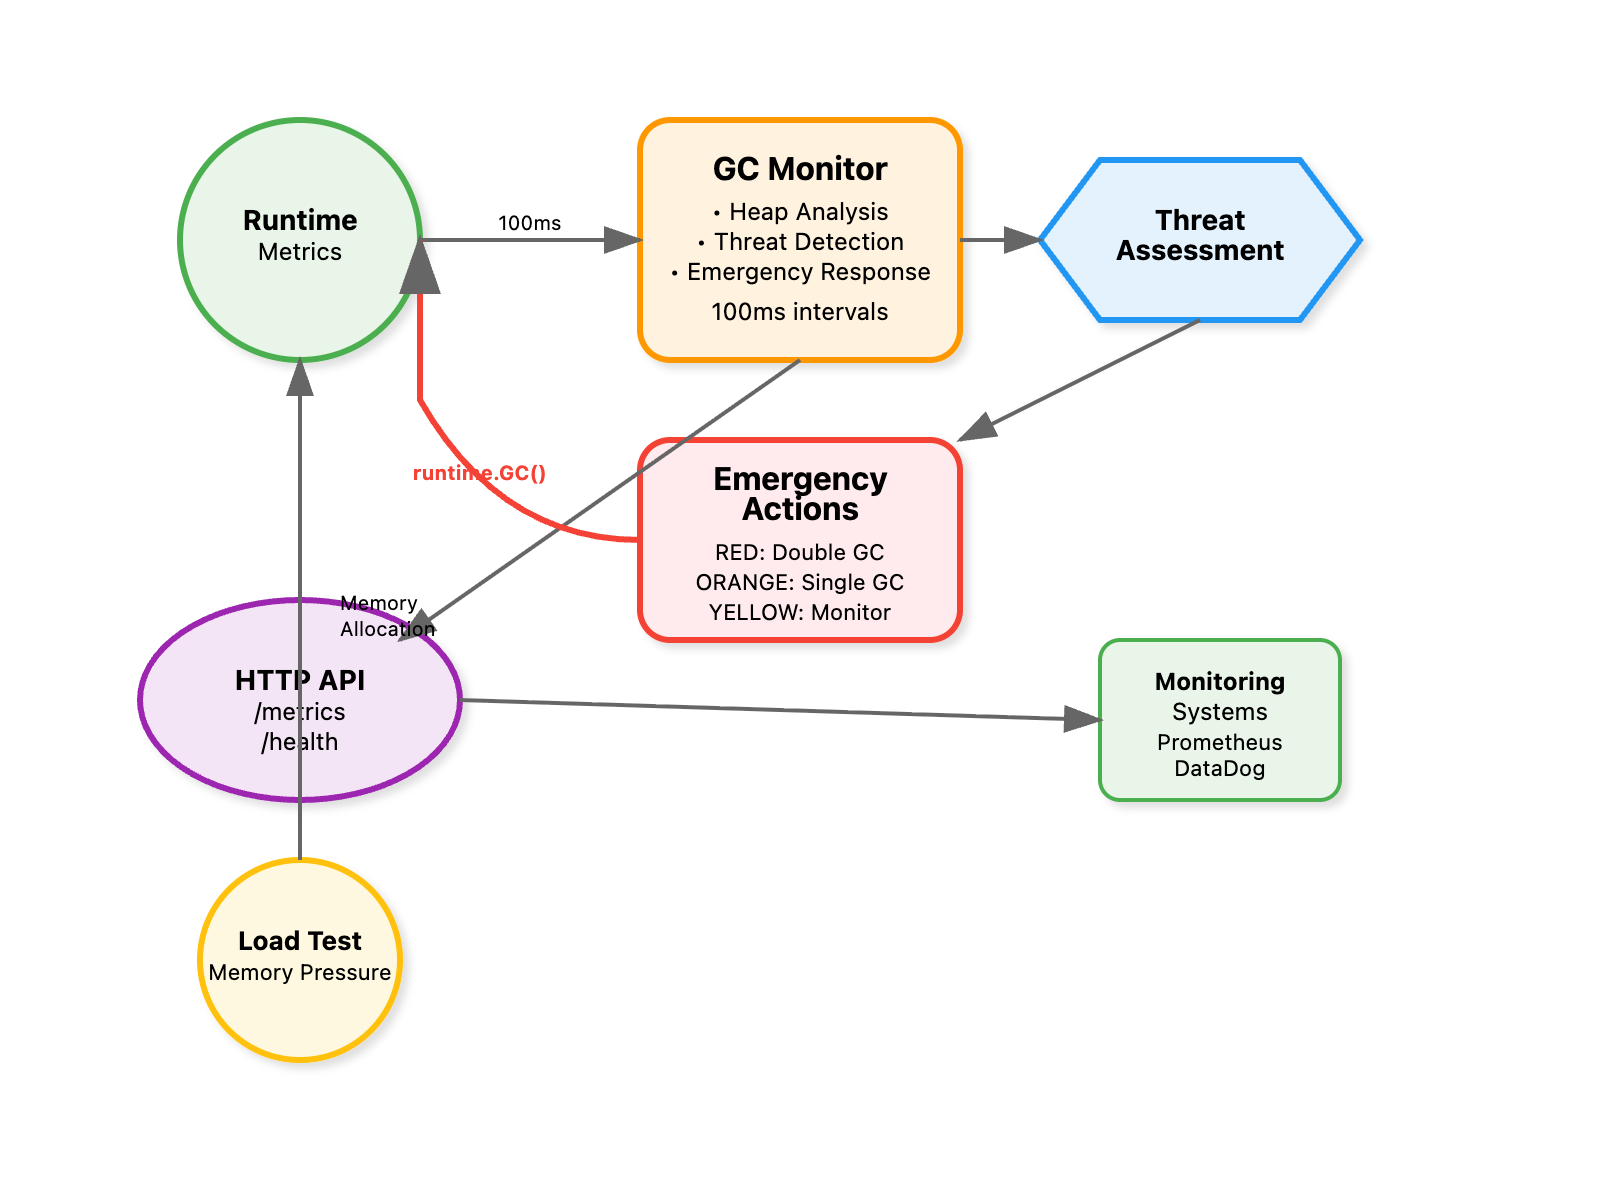
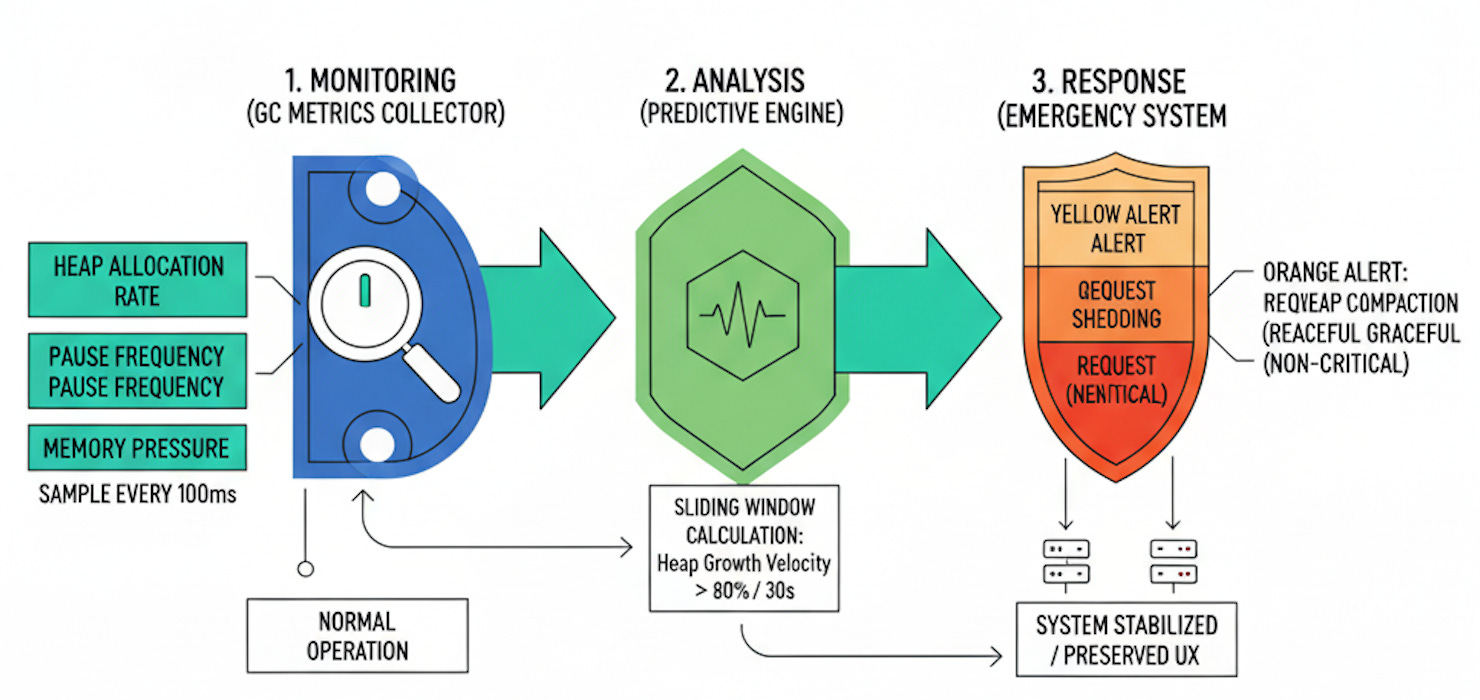
Our monitoring system consists of three critical components: a GC metrics collector that hooks into runtime statistics, a predictive analysis engine that detects pre-pause conditions, and an emergency response system that can trigger heap optimization or service degradation.
The collector samples heap allocation rates, pause frequencies, and memory pressure indicators every 100ms. The analyzer uses sliding window calculations to detect when allocation rates exceed sustainable thresholds—typically when heap growth velocity surpasses 80% of available memory within a 30-second window.
The emergency system implements a three-tier response: yellow alerts trigger preemptive minor collections, orange alerts enable request shedding for non-critical endpoints, and red alerts initiate graceful service degradation while performing major heap compaction
Production Deployment Patterns
The most effective pattern combines process-level monitoring with infrastructure-level orchestration. Deploy monitoring agents as sidecars that communicate with your orchestration layer (Kubernetes, Docker Swarm) to implement rolling restarts before GC pauses become service-affecting.
Advanced implementations use memory pools and object recycling to minimize allocation pressure. Companies like Discord reduced their GC pause frequency by 90% using pre-allocated buffer pools for message parsing—a pattern we'll implement in our demonstration.
The key insight: GC pauses are predictable events, not random failures. By monitoring allocation patterns and implementing proactive response mechanisms, you transform unpredictable service failures into managed, graceful degradations that preserve user experience and system stability.
📖 Implementation Playbook: Step-by-Step GC Monitoring
Quick Start Checklist
[ ] Go 1.19+ installed
[ ] Run
chmod +x setup.sh && ./setup.sh[ ] Execute
./bin/gc-monitorto start monitoring[ ] Run
./bin/loadtestin separate terminal[ ] Observe threat level escalations and automatic responses
Github Source code :
https://github.com/sysdr/howtech/tree/main/Garbage_collection
Step-by-Step Walkthrough
Step 1: Understanding the Monitoring Foundation
The core monitoring loop samples Go's runtime statistics every 100ms:
var ms runtime.MemStats
runtime.ReadMemStats(&ms)

// Critical metrics for GC prediction
heapUtil := float64(ms.HeapAlloc) / float64(ms.HeapSys) * 100
allocRate := heapDifference / timeElapsed
Verification: Start the monitor and curl localhost:8080/metrics to see real-time heap statistics. Notice how heap_used and allocation_rate change with system activity.
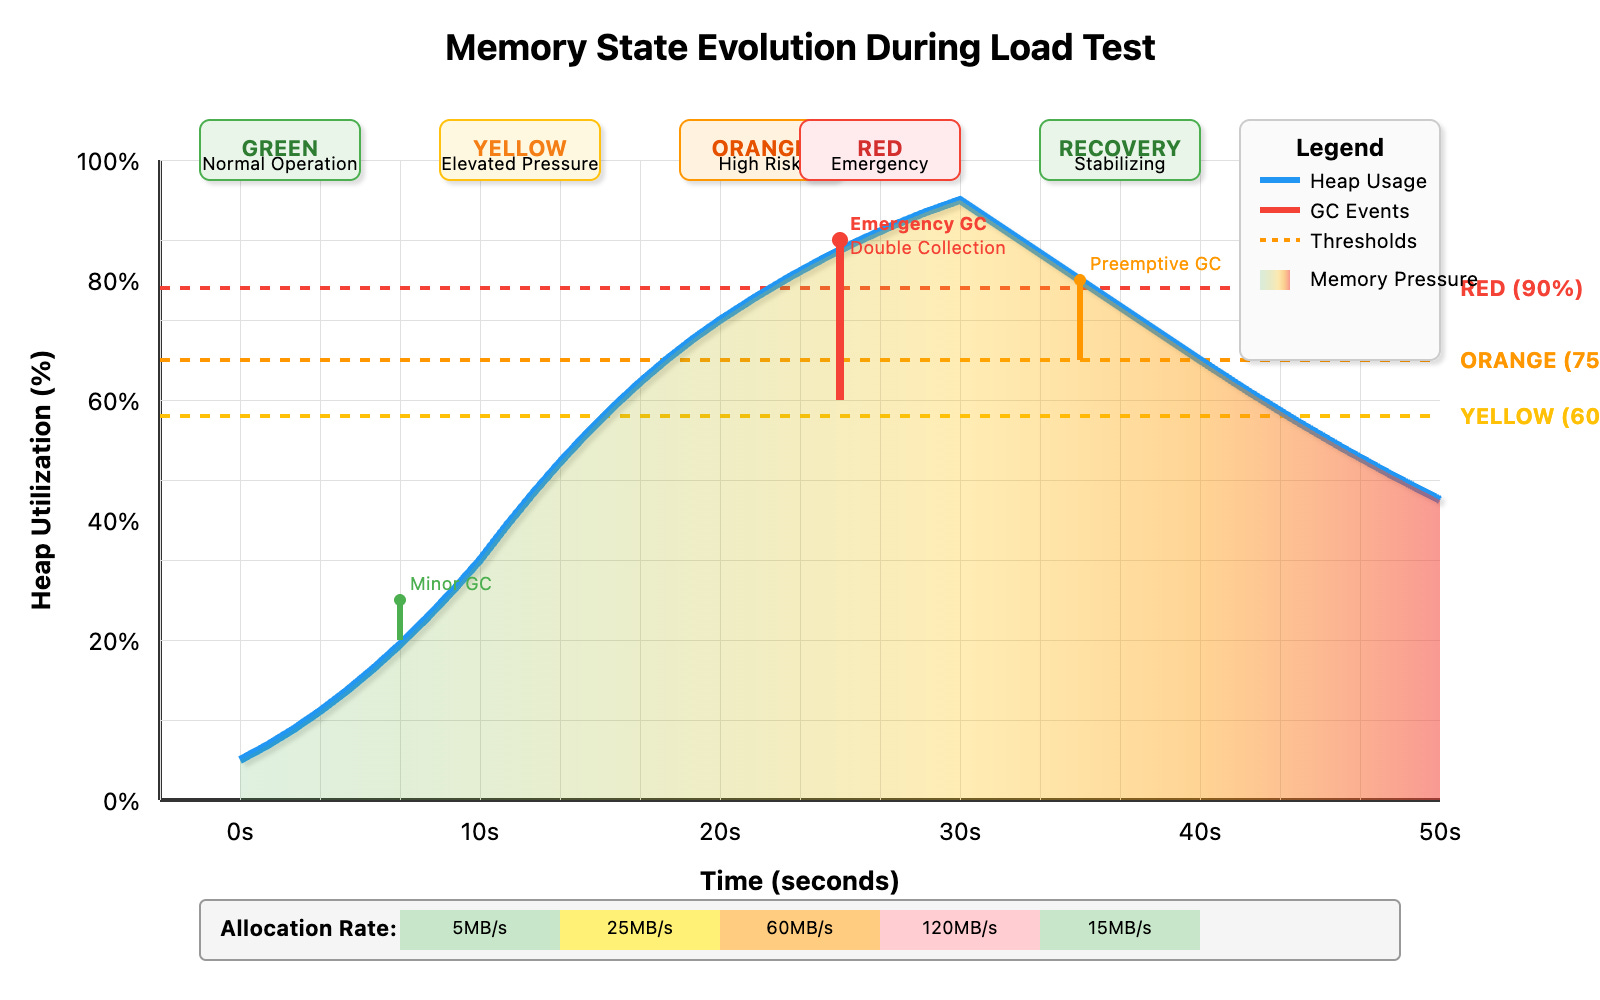
Step 2: Threat Level Assessment Algorithm
Our system uses a three-tier classification based on heap utilization and allocation velocity:
if heapUtil > 90 || allocRate > 100MB/sec {
    return "RED"    // Emergency intervention
} else if heapUtil > 75 || allocRate > 50MB/sec {
    return "ORANGE" // Preemptive action
} else if heapUtil > 60 || allocRate > 20MB/sec {
    return "YELLOW" // Early warning
}
Verification: Run the load test and watch console output. You'll see threat levels escalate from GREEN → YELLOW → ORANGE → RED as memory pressure increases.
Step 3: Emergency Response System
Each threat level triggers specific interventions:
switch threatLevel {
case "RED":
    runtime.GC()  // Force immediate collection
    runtime.GC()  // Double GC for thorough cleanup
case "ORANGE":
    runtime.GC()  // Single preemptive collection
case "YELLOW":
    // Enhanced monitoring only
}
Verification: During load test execution, observe the automatic GC triggers in logs. Notice how heap utilization drops immediately after RED/ORANGE alerts.
Step 4: Production Integration Patterns
For production deployment, extend the monitoring with circuit breaker logic:
type CircuitBreaker struct {
    failures    int
    lastFailure time.Time
    state       string // CLOSED, OPEN, HALF_OPEN
}

func (cb *CircuitBreaker) ShouldReject(threatLevel string) bool {
    if threatLevel == "RED" && cb.failures > 3 {
        return true // Reject non-critical requests
    }
    return false
}
Verification: The included configuration shows how to integrate with Docker Compose for container orchestration and health checks.
Step 5: Observability and Alerting
The metrics endpoint provides structured data for external monitoring systems:
{
    "timestamp": 1696789123456,
    "heap_size": 134217728,
    "heap_used": 98765432,
    "heap_objects": 456789,
    "gc_pauses": [150000, 180000, 120000],
    "allocation_rate": 52428800,
    "threat_level": "ORANGE"
}
Verification: Query the metrics endpoint during various system states to see how values correlate with actual performance. Use this data to tune your production alerting thresholds.
Advanced Configuration
Modify configs/monitor.yaml to adjust sensitivity:
thresholds:
  yellow:
    heap_utilization: 50  # More aggressive monitoring
    allocation_rate: 10971520  # 10MB/s (lower threshold)
This creates earlier warning signals for latency-sensitive applications where even minor GC pauses can impact user experience.
Troubleshooting Common Issues
High allocation rates without GC pressure: Check for memory leaks in long-lived object references. The system shows allocation velocity but can't detect retained references.
False positive RED alerts: Tune thresholds based on your application's memory patterns. Some applications naturally maintain high heap utilization during normal operation.
GC pauses still occurring: Our system prevents many pauses but can't eliminate all GC activity. For zero-pause requirements, consider off-heap storage patterns or alternative garbage collectors.