Flame Graphs and Visualization: Interpreting Call Stack Hotspots
Your PostgreSQL query is slow. You run a profiler, and it tells you
malloc()is consuming 40% of CPU time. Great. But which of your 50 code paths is calling malloc? Which caller should you optimize first?Traditional profilers give you flat profiles - function names with percentages. They don’t show you the call chains that matter. That’s where flame graphs save you hours of printf debugging and guessing.
The Sampling Reality
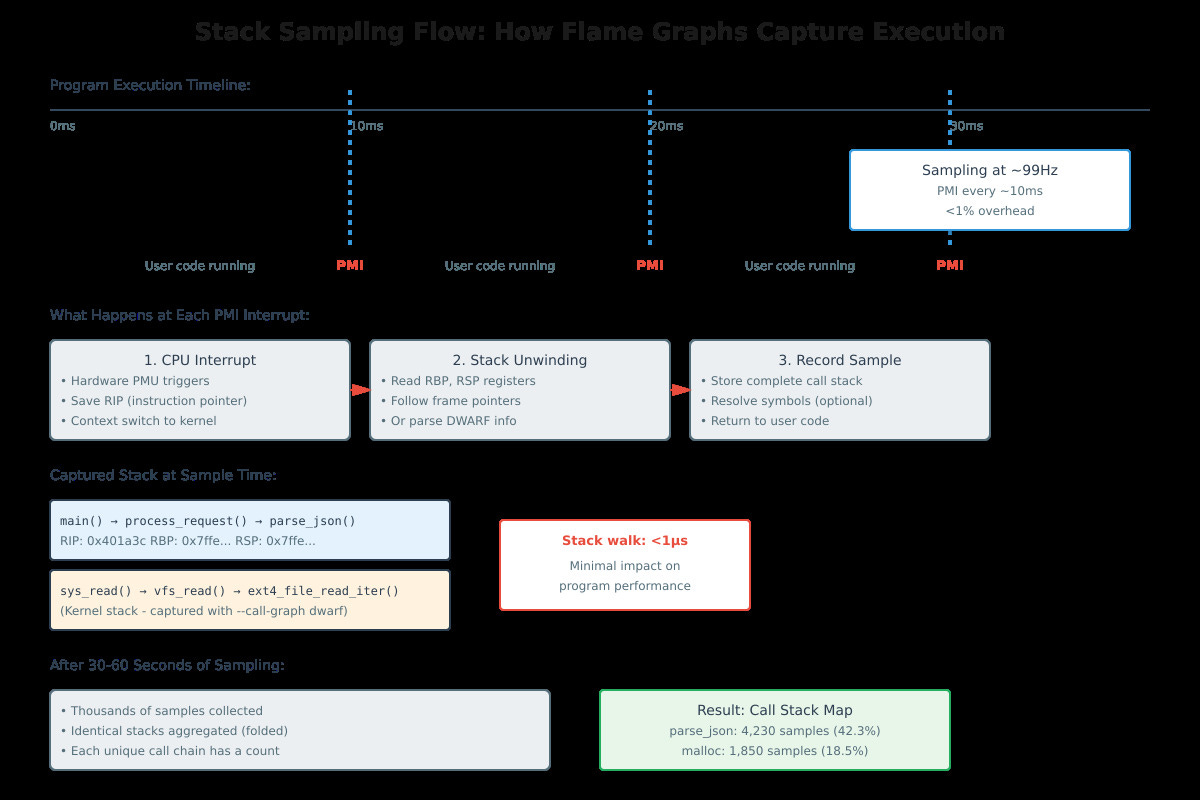
Flame graphs work through statistical profiling. Every ~10 milliseconds, the kernel interrupts your program, captures the instruction pointer and walks the stack to record the complete call chain. After thousands of samples, you have a map of where your program actually spends time.
This is not instrumentation - you’re not injecting code into every function. The overhead is under 1% because stack unwinding takes microseconds. The PMU (Performance Monitoring Unit) in your CPU triggers interrupts at a configured frequency, typically 99-999 Hz for production profiling.