
Fast System Calls: How getpid() Went From Slow to Instant
The Problem: Death by a Thousand Syscalls
You’re debugging a service that’s burning 30% CPU doing seemingly nothing. Profiling shows millions of
getpid()calls from a logging library that helpfully includes the PID in every log line. Each call looks harmless—just fetch a number the kernel already knows. But at 100 nanoseconds per call and 10 million logs per second, you’re spending 1 full CPU core just asking “who am I?”This is exactly the kind of overhead that killed performance before vDSO. Every
getpid()required a full context switch: save all registers, transition from ring 3 to ring 0, execute kernel code, restore registers, return. The syscall overhead dwarfed the actual work—fetching an integer from a struct.
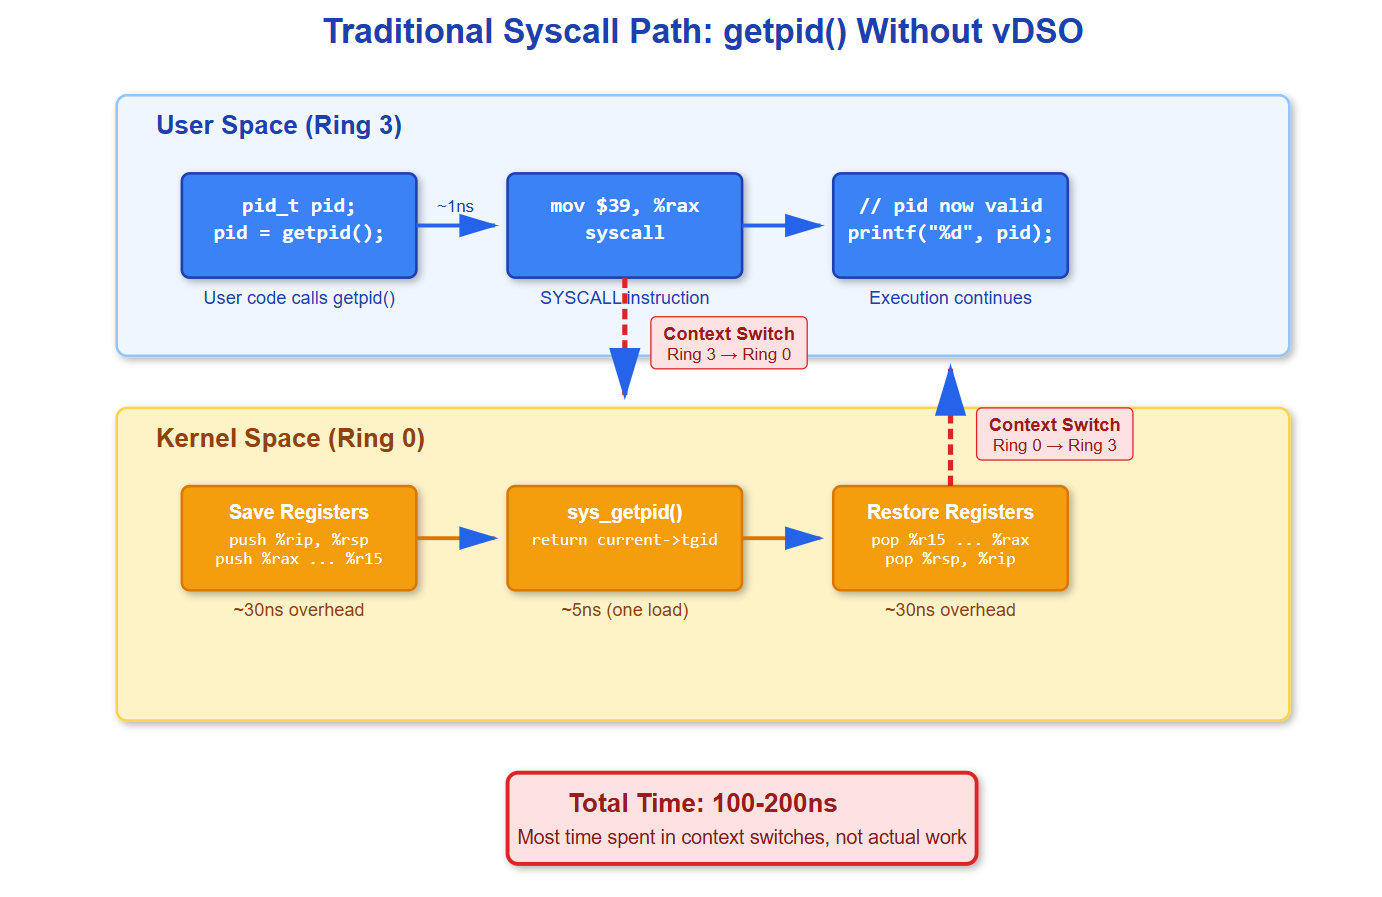
How Syscalls Actually Work (The Slow Path)
When you call
getpid()without vDSO, here’s what happens at the CPU level:The
SYSCALLinstruction (x86-64) triggers a privilege level change. Your CPU switches from ring 3 (user mode) to ring 0 (kernel mode). It saves your instruction pointer and stack pointer into MSRs (Model Specific Registers), then jumps to the kernel’s syscall entry point.The kernel entry code saves all your registers to the stack—RIP, RSP, RFLAGS, plus general purpose registers. It looks up syscall number 39 (getpid on x86-64) in the syscall table and calls
sys_getpid().
Inside sys_getpid(), the kernel does exactly one thing:
c
SYSCALL_DEFINE0(getpid)
{
return task_tgid_vnr(current);
}
```
It reads `current->tgid` (thread group ID, which is the PID) from the task_struct. That’s it. One pointer dereference.
Then everything reverses: restore registers, execute `SYSRET` instruction, CPU switches back to ring 3, execution continues in user space. Total cost: 100-200 nanoseconds on modern hardware. For comparison, an L1 cache hit is 1 nanosecond.
You just spent 100-200 CPU cycles to read one cached integer.
## The vDSO Solution: Syscalls Without Syscalls
Linux kernel developers looked at frequently-called syscalls that only read kernel data and asked: why context switch at all?
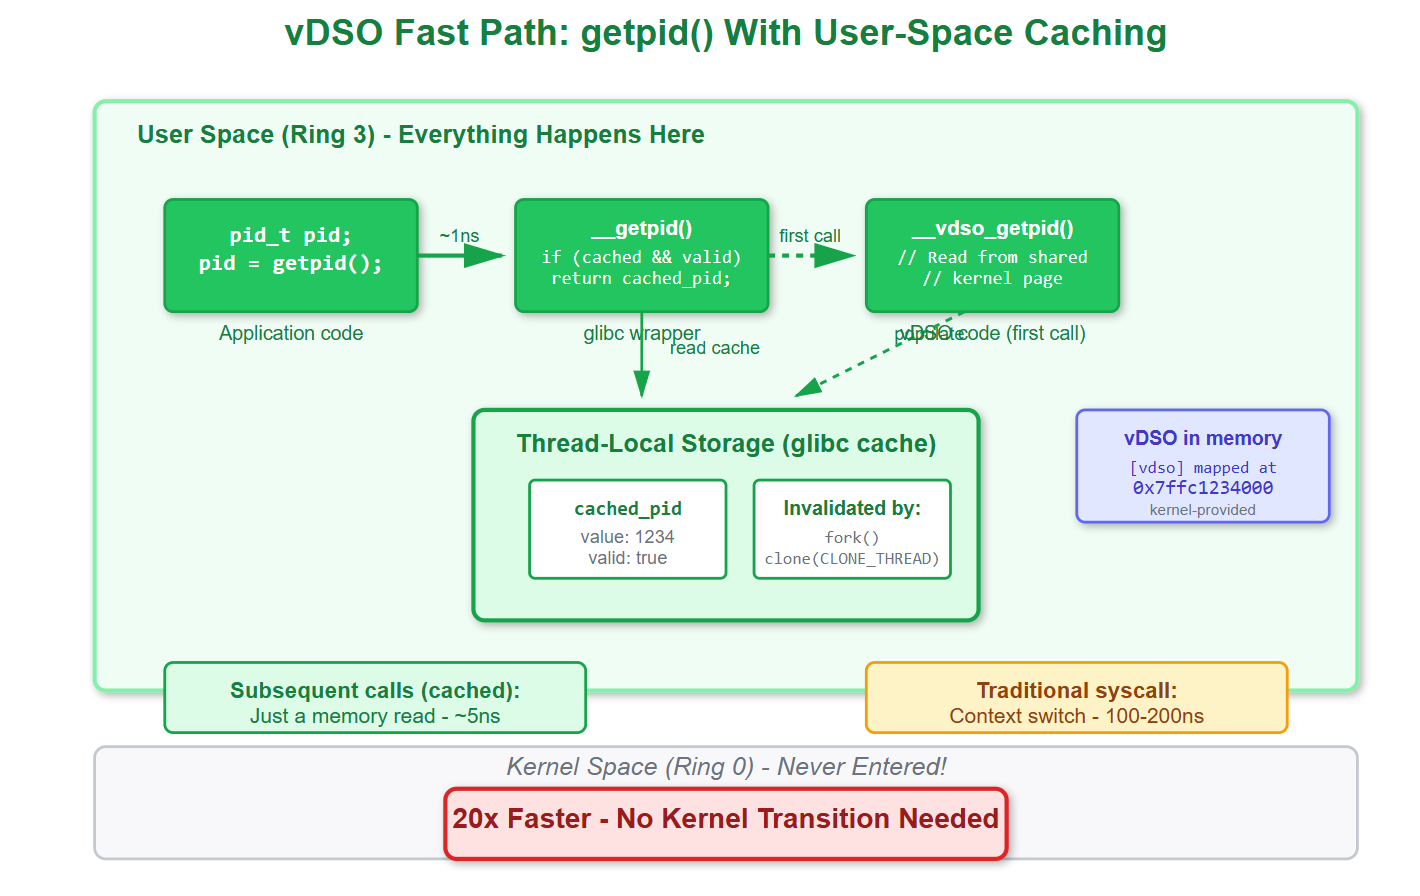
The vDSO (Virtual Dynamic Shared Object) is a small shared library that the kernel maps directly into every process’s address space. It contains user-space implementations of certain syscalls. When you call `getpid()`, glibc’s wrapper checks if vDSO is available and jumps to `__vdso_getpid` instead of executing `SYSCALL`.
The vDSO code runs entirely in user space (ring 3). For `getpid()`, glibc actually caches the PID in thread-local storage after the first call. Subsequent calls just return the cached value—a single memory read. No syscall, no context switch, no kernel code.
Cost: ~5 nanoseconds. That’s 20x faster than the traditional path.
**[IMAGE 2: vDSO fast path showing how the call stays in user space and reads from glibc’s cache]**
The kernel invalidates this cache when necessary—after `fork()` or `clone()` with `CLONE_THREAD`. The next `getpid()` call detects the invalidation and updates the cache. This is why you should never try to cache PIDs yourself; glibc already does it correctly.
Other syscalls also use vDSO: `gettimeofday()`, `clock_gettime()`, `getcpu()`. Anything that just reads relatively stable kernel data. The kernel updates a shared memory region that vDSO code can read, avoiding syscalls entirely for time queries.
## When vDSO Breaks (And How to Debug It)
In some containers, security policies disable vDSO. Seccomp filters can force all syscalls through the audit path. Suddenly your “free” `getpid()` calls become expensive again.
You can observe this with `strace`. With vDSO active, `strace ./your-program` shows no `getpid()` syscalls—they’re intercepted in user space before reaching the kernel. Disable vDSO (via `setarch x86_64 -R` or container restrictions), and `strace` shows every single call.
Check `/proc/self/maps` in your process. You’ll see a line like:
```
7ffce9bfe000-7ffce9c00000 r-xp 00000000 00:00 0 [vdso]If it’s missing, vDSO is disabled and you’re paying full syscall cost.
Performance measurements tell the story. Run getpid() 10 million times with vDSO: 50 milliseconds. Force the syscall path: 1.5 seconds. That’s 30x slower. Scale this to billions of operations and suddenly your monitoring overhead is measurable.
What You Should Do
First, never call getpid() in tight loops. If you need it repeatedly, call once and save the result. Even with vDSO, you’re doing unnecessary work.
Second, check if your runtime disables vDSO. Examine /proc/self/maps at startup. If you’re missing the vDSO mapping and performance matters, investigate your container security policies.
Third, understand that glibc caches aggressively. After fork(), both parent and child need to call getpid() again—the cached value is wrong. Most code doesn’t notice because the next getpid() call detects the stale cache and fixes it. But if you’re doing weird things with PIDs in signal handlers or clone wrappers, this matters.
Finally, use this knowledge for other syscalls. Is your code calling clock_gettime() millions of times per second? That’s vDSO-accelerated too. Are you calling read() on /proc/self/stat to get the PID? You just forced a syscall, filesystem lookup, and sprintf where a cached integer would do.
The fastest code is code that doesn’t run. vDSO is Linux’s way of making frequently-needed information available without the syscall tax. Understanding when and how it works is the difference between fast systems code and code that mysteriously burns CPU doing “nothing.”
Building and Testing the Demo
Github Link :
https://github.com/sysdr/howtech/tree/main/fast_system_callsRequirements
You’ll need a Linux system with:
GCC compiler
make
strace
Step 1: Create the Benchmark Program
Save this as getpid_bench.c:
c
#define _GNU_SOURCE
#include <stdio.h>
#include <stdlib.h>
#include <unistd.h>
#include <time.h>
#include <sys/syscall.h>

#define ITERATIONS 10000000
#define NS_PER_SEC 1000000000L

static inline long long timespec_diff_ns(struct timespec *start, struct timespec *end) {
    return (end->tv_sec - start->tv_sec) * NS_PER_SEC +
           (end->tv_nsec - start->tv_nsec);
}

static inline pid_t raw_getpid(void) {
    return (pid_t)syscall(SYS_getpid);
}

int main(int argc, char **argv) {
    struct timespec start, end;
    long long elapsed_ns;
    double ns_per_call;
    int use_vdso = 1;

    if (argc > 1 && strcmp(argv[1], “--no-vdso”) == 0) {
        use_vdso = 0;
    }

    printf(”\ngetpid() Performance Benchmark\n”);
    printf(”Method: %s\n”, use_vdso ? “glibc getpid() with vDSO” : “raw syscall”);

    clock_gettime(CLOCK_MONOTONIC, &start);

    if (use_vdso) {
        for (int i = 0; i < ITERATIONS; i++) {
            getpid();
        }
    } else {
        for (int i = 0; i < ITERATIONS; i++) {
            raw_getpid();
        }
    }

    clock_gettime(CLOCK_MONOTONIC, &end);
    elapsed_ns = timespec_diff_ns(&start, &end);
    ns_per_call = (double)elapsed_ns / ITERATIONS;

    printf(”\nResults:\n”);
    printf(”  Total time:   %.3f ms\n”, elapsed_ns / 1000000.0);
    printf(”  Per call:     %.2f ns\n”, ns_per_call);
    printf(”  Throughput:   %.2f M calls/sec\n\n”, ITERATIONS / (elapsed_ns / 1000.0));

    return 0;
}
Step 2: Create the vDSO Inspector
Save this as vdso_inspector.c:
c
#define _GNU_SOURCE
#include <stdio.h>
#include <stdlib.h>
#include <string.h>
#include <sys/auxv.h>

int main(void) {
    unsigned long vdso_addr = getauxval(AT_SYSINFO_EHDR);

    printf(”\nvDSO Status Check\n”);

    if (vdso_addr != 0) {
        printf(”  vDSO base address: 0x%lx\n”, vdso_addr);
    } else {
        printf(”  vDSO not found!\n”);
    }

    FILE *maps = fopen(”/proc/self/maps”, “r”);
    char line[512];
    int found = 0;

    while (fgets(line, sizeof(line), maps)) {
        if (strstr(line, “[vdso]”)) {
            printf(”  Memory mapping: %s”, line);
            found = 1;
            break;
        }
    }

    if (!found) {
        printf(”  vDSO not in memory map\n”);
    }

    fclose(maps);
    printf(”\n”);
    return 0;
}
Step 3: Build Everything
bash
gcc -Wall -Wextra -O2 -o getpid_bench getpid_bench.c
gcc -Wall -Wextra -O2 -o vdso_inspector vdso_inspector.c
Step 4: Run the Tests
Check if vDSO is available:
bash
./vdso_inspectorBenchmark with vDSO (fast path):
bash
./getpid_benchBenchmark with direct syscall (slow path):
bash
./getpid_bench --no-vdsoSee it with strace:
bash
# Create a simple test program
cat > test.c << ‘EOF’
#include <stdio.h>
#include <unistd.h>
int main(void) {
    for (int i = 0; i < 5; i++) {
        printf(”PID: %d\n”, getpid());
    }
    return 0;
}
EOF

gcc -o test test.c
strace -e trace=getpid ./test
With vDSO active, strace shows NO getpid() syscalls. The calls happen entirely in user space.
What You’ll See
On a modern Linux system with vDSO enabled:
vDSO path: ~5-10 ns per call
Syscall path: ~100-200 ns per call
20x performance difference
The benchmarks prove that eliminating context switches makes a massive difference, even for the simplest syscalls.