
Dissecting the syscall Instruction: Kernel Entry and Exit Mechanisms.
When Your Code Crosses Into the Kernel
You call read(). Your CPU shifts into another gear. Privilege level drops from 3 to 0. Your instruction pointer jumps to an address you can’t even see from user space. This happens millions of times per second on production servers, and most developers have no idea what’s actually going on.
Here’s what they don’t tell you: the syscall instruction is one of the most carefully orchestrated handoffs in computing. Get it wrong, and you corrupt kernel memory. Get it slow, and your entire system grinds to a halt.
The Problem Nobody Talks About
Back when we used int 0x80 for system calls, every transition burned 200+ cycles. The CPU had to walk the Interrupt Descriptor Table, check permissions, switch stacks, save everything. For high-frequency operations like networking or disk I/O, this overhead was killing performance. Google’s servers were spending 30% of their CPU time just entering and exiting the kernel.
Intel gave us syscall/sysret in x86-64. Much faster, but way more fragile. The CPU does less for you automatically, which means the kernel has to be very careful about what it touches and when.
Complete syscall flow from user space through kernel entry to sysret return, showing register state transformations
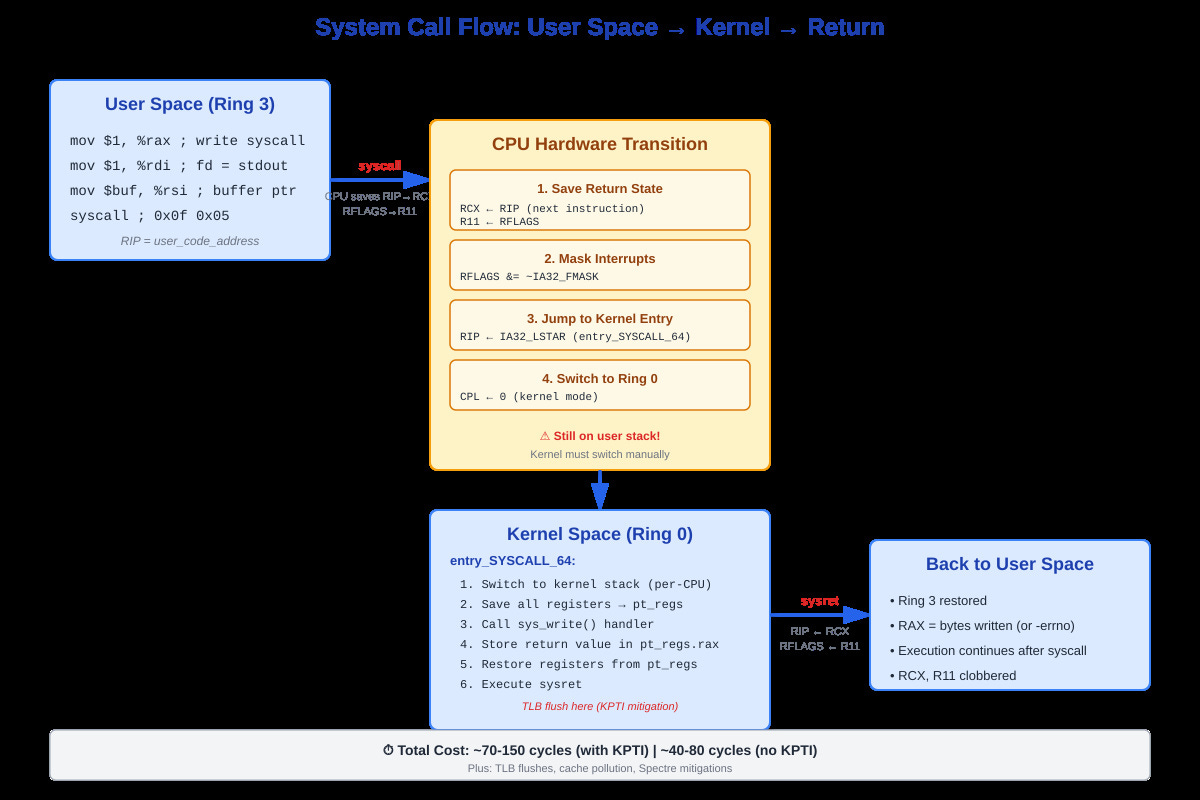
What Actually Happens When You Execute syscall
Your CPU does four things atomically:
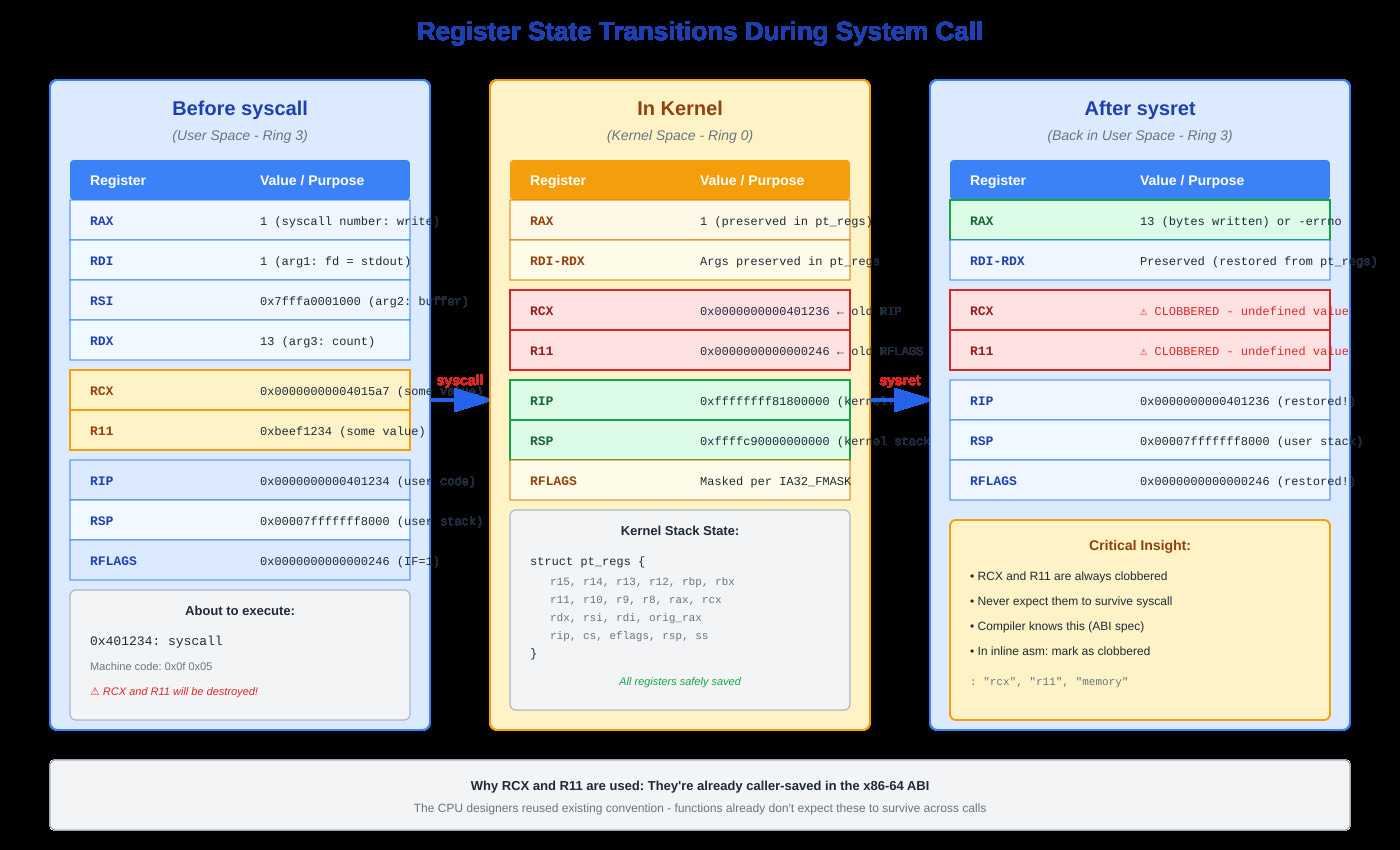
First, it saves your current instruction pointer to RCX and your flags register to R11. Your syscall number sits in RAX, arguments in RDI, RSI, RDX, R10, R8, R9. Note that fourth argument: it’s R10, not RCX like normal function calls. Why? Because syscall destroys RCX.
Second, it masks interrupts according to IA32_FMASK MSR. You don’t want an interrupt firing while you’re halfway through the mode transition with inconsistent state.
Third, it loads a new instruction pointer from the IA32_LSTAR MSR. This points to entry_SYSCALL_64 in the kernel. There’s no stack switch yet - you’re still on the user stack, but now running kernel code. This is the dangerous moment.
Fourth, it flips your privilege level from ring 3 to ring 0. You can now execute privileged instructions and access kernel memory. Your page tables are still pointing at user space mappings, though - the kernel code is mapped into every process’s address space above 0xffff800000000000.
The kernel entry code immediately switches to a per-CPU kernel stack. It has to - you can’t trust the user stack pointer. Then it builds a pt_regs structure: saves all your registers in a specific order so the kernel can restore them later. This structure lives on the kernel stack and travels through the entire syscall path.
The Return Path Is Just As Tricky
When the syscall handler finishes, it writes the return value to RAX in your saved pt_regs. Then entry_SYSCALL_64_return restores all registers from that structure, switches back to your user stack, and executes sysret.
Here’s where Spectre bit us hard: we now have to flush the TLB on every kernel entry and exit (KPTI mitigation). That’s an extra 30-70 cycles per syscall. On syscall-heavy workloads, this single mitigation can cost 20-30% of your performance.
Register state diagram showing before syscall, during kernel execution, and after sysret, with RCX/R11 special handling highlighted
The Numbers That Matter
A null syscall (like getpid()) costs about 70-100 cycles on modern CPUs. That sounds fast until you realize you’re making 2 million per second. Suddenly you’re burning 7% of your CPU just on the transitions.
Here’s what actually hurts:
TLB flushes: Post-Meltdown, we invalidate TLB entries on every mode switch. That’s thousands of cycles if you immediately access memory that needs translation.
Cache pollution: The kernel entry code and your syscall handler evict your user-space hot data from L1/L2 cache. When you return, you take cache misses on data that was in cache 100 nanoseconds ago.
Spectre mitigations: IBRS (Indirect Branch Restricted Speculation) adds cycles to every indirect branch in kernel space. Some syscall paths got 40% slower overnight.
Real production data: after Meltdown patches, one of our services went from 120k req/s to 85k req/s. Same code, same hardware. We had to redesign it to batch operations and use io_uring to keep only 10% of the syscalls.
What You Can Actually Do
First, measure. Run perf stat -e ‘syscalls:sys_enter_*’ on your process. If you’re seeing >100k syscalls per second, you have a problem. Check the distribution - perf trace shows which syscalls dominate.
Batch operations. Instead of 1000 individual write() calls, use writev(). Instead of many stat calls, use getdents() and parse directory entries yourself. Every avoided syscall is 100 cycles you get back.
Use vDSO. Functions like gettimeofday() and clock_gettime(CLOCK_MONOTONIC) don’t actually enter the kernel on modern systems - they read from a shared memory page the kernel updates. This drops from 80ns to 15ns.
Consider io_uring. If you’re doing lots of I/O, io_uring lets you submit batches of operations through shared ring buffers with minimal syscalls. We cut syscall rate by 90% on a file server this way.
Want to see it yourself? The demo shows syscall costs under different scenarios - with and without KPTI, comparing direct syscalls vs vDSO, measuring the actual register state transitions. Run ./demo.sh and watch your CPU mode-switch in real time.
The syscall instruction looks simple: one byte, 0x0f 0x05. But that byte triggers a carefully choreographed dance between CPU and kernel that’s been optimized for 20 years. Understanding it means understanding why your “fast” code is actually slow, and what you can do about it.
Github repository : https://github.com/sysdr/howtech/tree/main/systems/syscall