Deploying Network Security Monitoring with eBPF and Tracepoints
Every outbound connection your service makes passes through three kernel layers before the first byte reaches the wire.
libpcapsees the packet at the NIC — after it has already left the socket layer, after the process context has dissolved into just a source IP and port. AF_PACKET gives you the same picture, slightly earlier, with the same fundamental gap: you cannot tell which PID initiated this connection from packet data alone. That association lives in the socket table and evaporates the moment the socket closes.eBPF tracepoints attach before any of that happens.
Tracepoints Are Not kprobes
The distinction matters more than most articles acknowledge. kprobes attach dynamically by patching an int3 instruction at a function’s entry point at runtime. When the kernel is upgraded and that function gets inlined into its caller, renamed, or split — your probe silently stops firing or attaches to the wrong site. Production systems have broken this way after routine kernel updates.
Tracepoints are different. They are static instrumentation sites that kernel developers placed deliberately and annotated for stability. The definition lives in include/trace/events/, and the compiler emits a nop at the callsite. When a BPF program attaches, that nop becomes a direct call. No breakpoints, no trampolines — and more importantly, no silent breakage across kernel upgrades. When the kernel ABI for a tracepoint changes, it changes explicitly and publicly.
For network security monitoring, three tracepoints cover the majority of what matters:
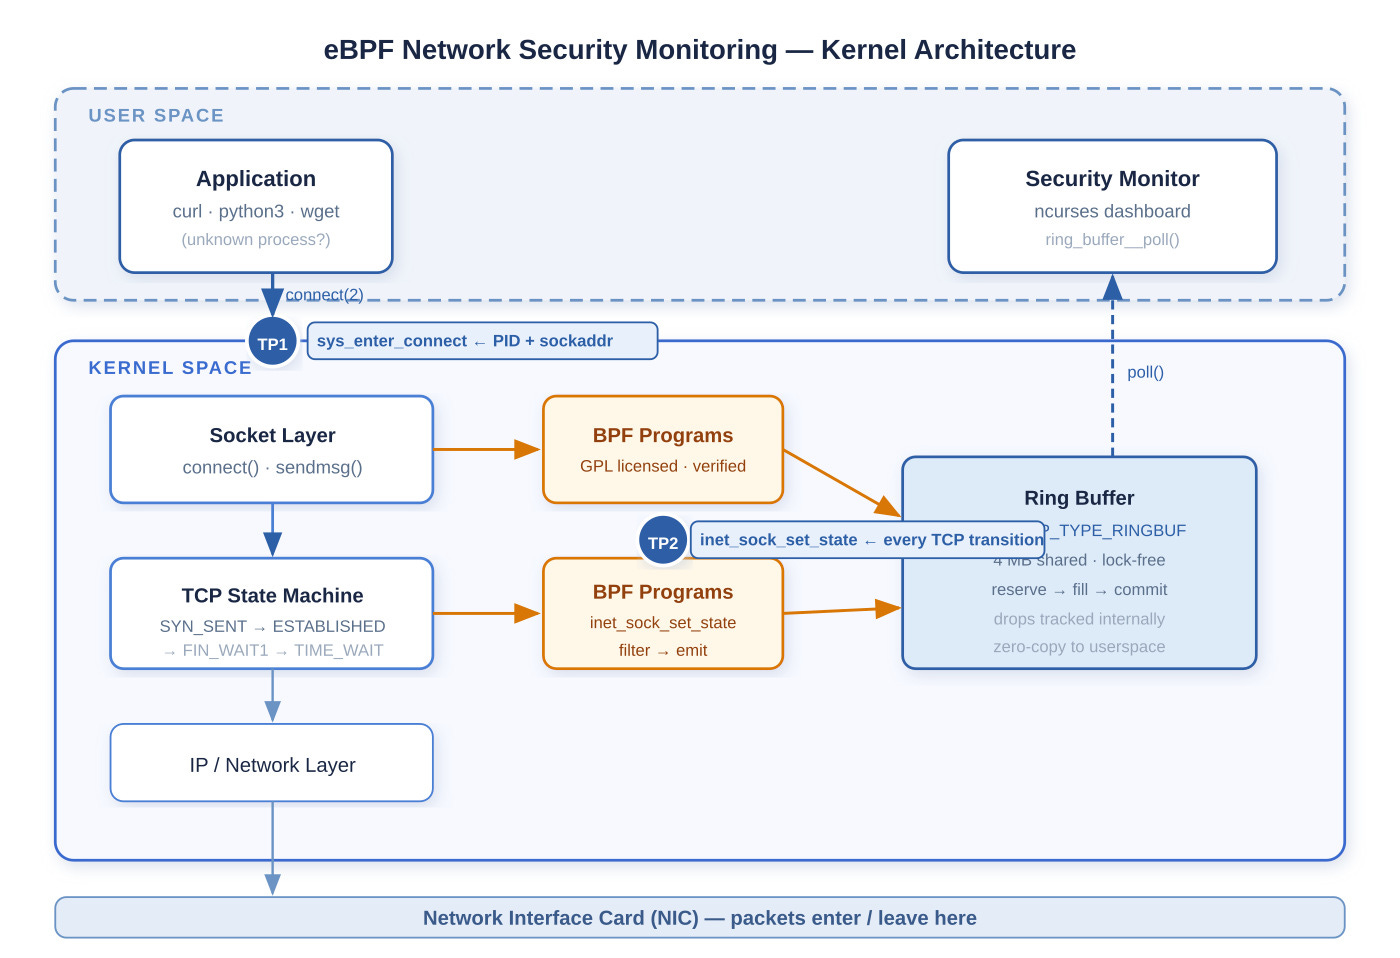
tracepoint/syscalls/sys_enter_connect fires the instant a process calls connect(2), before the kernel processes the destination address. You receive the calling PID, comm string, and the raw sockaddr from userspace memory. This is where unexpected outbound calls, port scans, and malware beaconing first become observable — before the connection exists.
tracepoint/sock/inet_sock_set_state fires on every TCP state transition. From one attachment point you reconstruct the full lifecycle of every TCP connection on the host: when SYN_SENT became ESTABLISHED (connection succeeded), when it went directly to CLOSE (connection refused — potentially port scan behavior), when FIN_WAIT began, and the microsecond timestamp of each change. Combined with sys_enter_connect, you have the complete record: process, destination, outcome, and duration.
tracepoint/tcp/tcp_retransmit_skb fires when the TCP retransmit timer fires. Unexplained retransmit spikes at scale correlate with reflection attacks, congestion, and misconfigured middleboxes in ways that packet captures alone cannot contextualize without the per-connection metadata this tracepoint provides.