1. Introduction
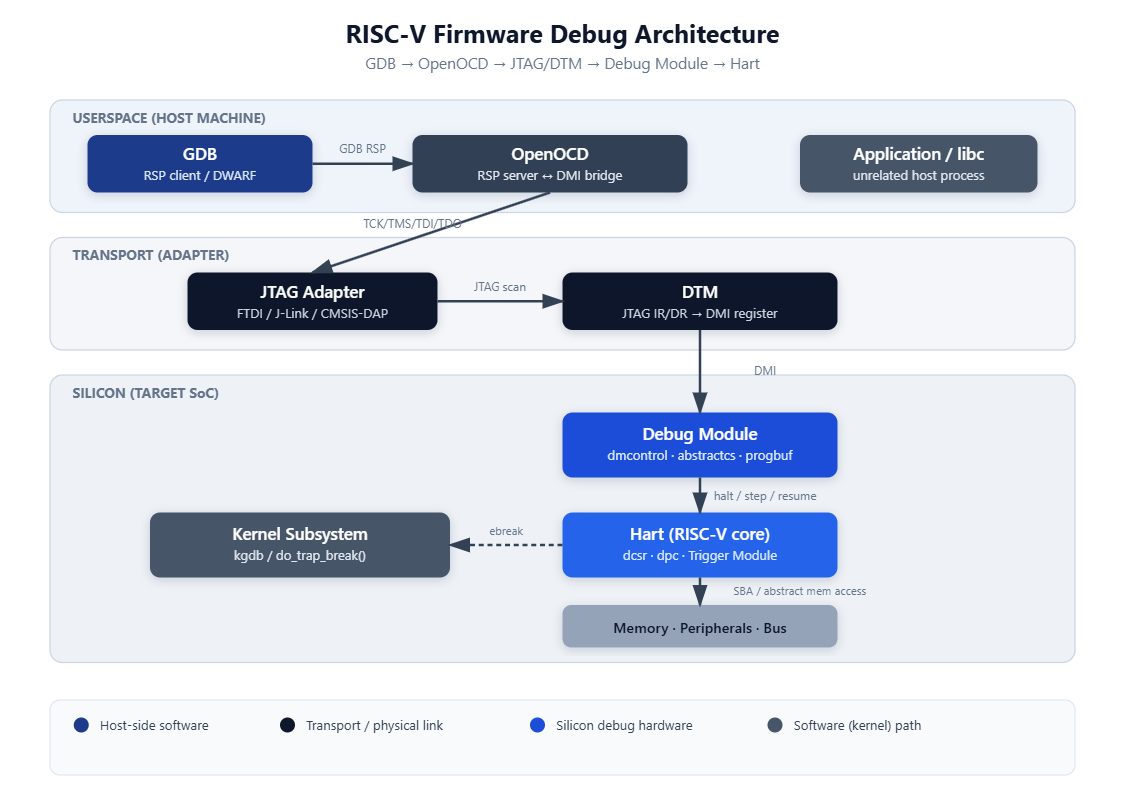
Debugging firmware is fundamentally different from debugging a userspace process. There is no ptrace(), no scheduler to preempt into a debugger, and frequently no operating system at all — just a hart sitting at its reset vector, executing whatever is in flash or ROM. On RISC-V, the mechanism that makes this possible is not a proprietary vendor protocol but an open, ratified specification: the RISC-V External Debug Support spec, which defines a hardware Debug Module (DM) inside the core, accessible over a transport such as JTAG. OpenOCD implements the host side of that transport and exposes a GDB Remote Serial Protocol (RSP) server; GDB becomes the client. Understanding this stack — from electrical signal to source line — is what separates an engineer who can bring up silicon from one who can only debug applications.
This lesson walks through the entire path: the historical reasons RISC-V standardized debug hardware instead of leaving it vendor-specific, how the Debug Module talks to a halted hart, how GDB’s RSP maps onto DM registers through OpenOCD, and how the same infrastructure underpins kgdb once Linux is actually running on the core.