Correlating Network Events and Process Context using eBPF Maps
Understanding the Problem
When a production system starts showing mysterious network errors, traditional tools leave you blind. Running
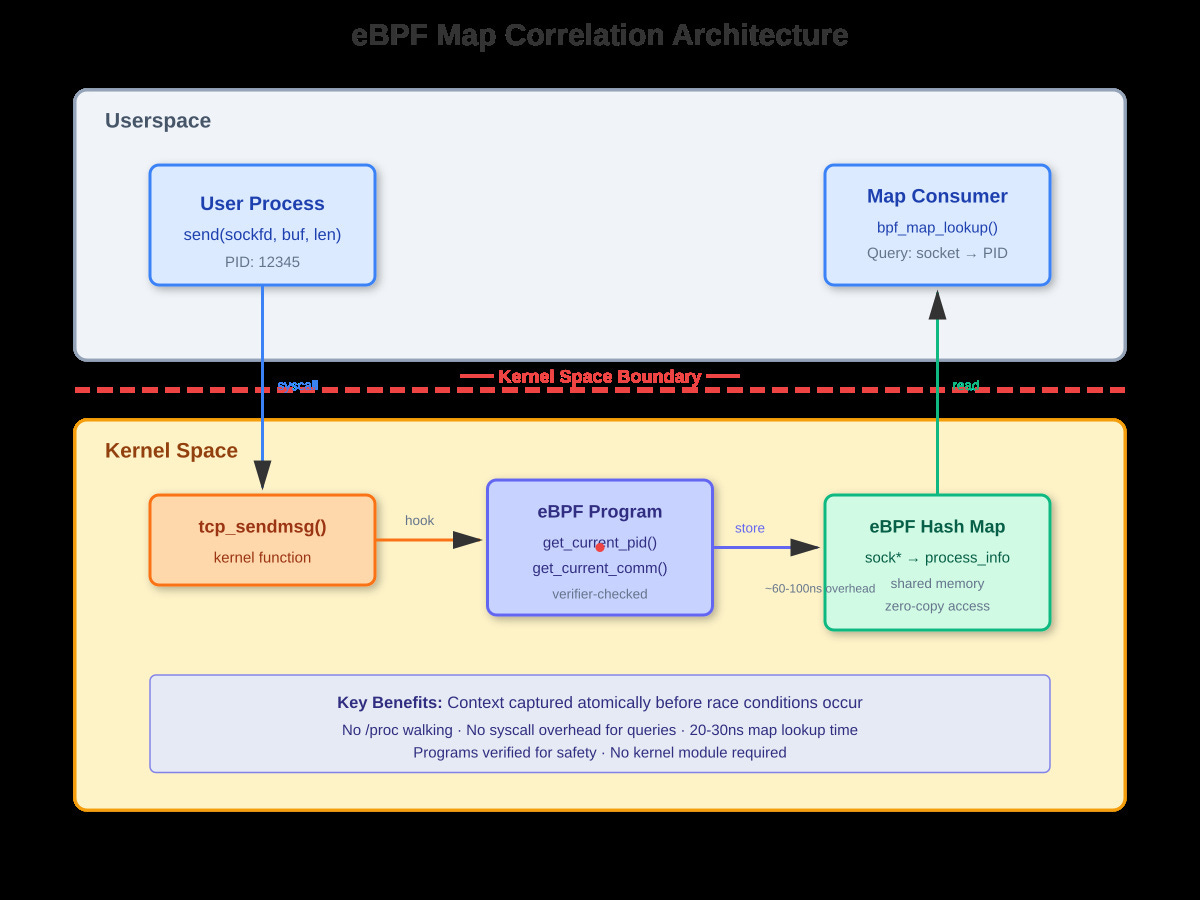
ss -tulpnshows you connections, but by the time you read/proc/net/tcp, the socket’s gone.netstattells you port 8080 is busy, but which of your twelve microservices is actually holding it? The race condition between observing network state and querying process information means you’re debugging with incomplete data.eBPF maps solve this by capturing network events and process context atomically in kernel space. When
tcp_sendmsg()fires, your eBPF program sees the socket, the sending process, and can correlate them before any race conditions occur. The data lands in a shared map that userspace can query without syscall overhead.
The Traditional Observability Gap
Tools like
lsofandsswork by reading/proc/net/tcpand matching inodes to file descriptors across/proc/[pid]/fd/. This has three fatal flaws: First, short-lived connections disappear before you can correlate them. Second, the multi-step lookup creates race windows where processes can fork, exec, or exit. Third, in containerized environments with thousands of ephemeral connections per second, the overhead of walking/procbecomes prohibitive.At LinkedIn’s scale, we saw this manifest as: HTTP 5xx errors attributed to the wrong service because connection pooling meant the socket FD was reused. The process that created the socket wasn’t the one that sent the failing request. Traditional tools showed us the current owner, not the connection history.
How eBPF Maps Work
eBPF maps are type-safe hash tables, arrays, or ring buffers that exist in kernel memory but are accessible from both eBPF programs and userspace via the bpf() syscall. A BPF_MAP_TYPE_HASH with key struct sock * and value struct process_info lets you store process context when a socket is created, then look it up on every send() or recv() with zero copying.