
Attributing Container Network Usage with eBPF Telemetry
Part I — The Article
You’re running a Kubernetes cluster with a dozen pods sharing a node. Bandwidth on
eth0spikes to 800 Mbps.iftoptells you it’s coming from the node’s IP. Your metrics dashboard shows nothing per-pod because your container runtime never wired upnet_clsclassids, andnethogsdoesn’t speak network namespaces. You’re billing multi-tenant workloads on shared infrastructure and you have no idea which container is burning the link.This is the attribution problem, and it’s older than Kubernetes. The kernel has always known which process owns which socket — but getting that mapping across namespace boundaries, at wire speed, without per-packet syscall overhead, requires eBPF.
What the Kernel Already Knows
Every packet the kernel processes travels through a
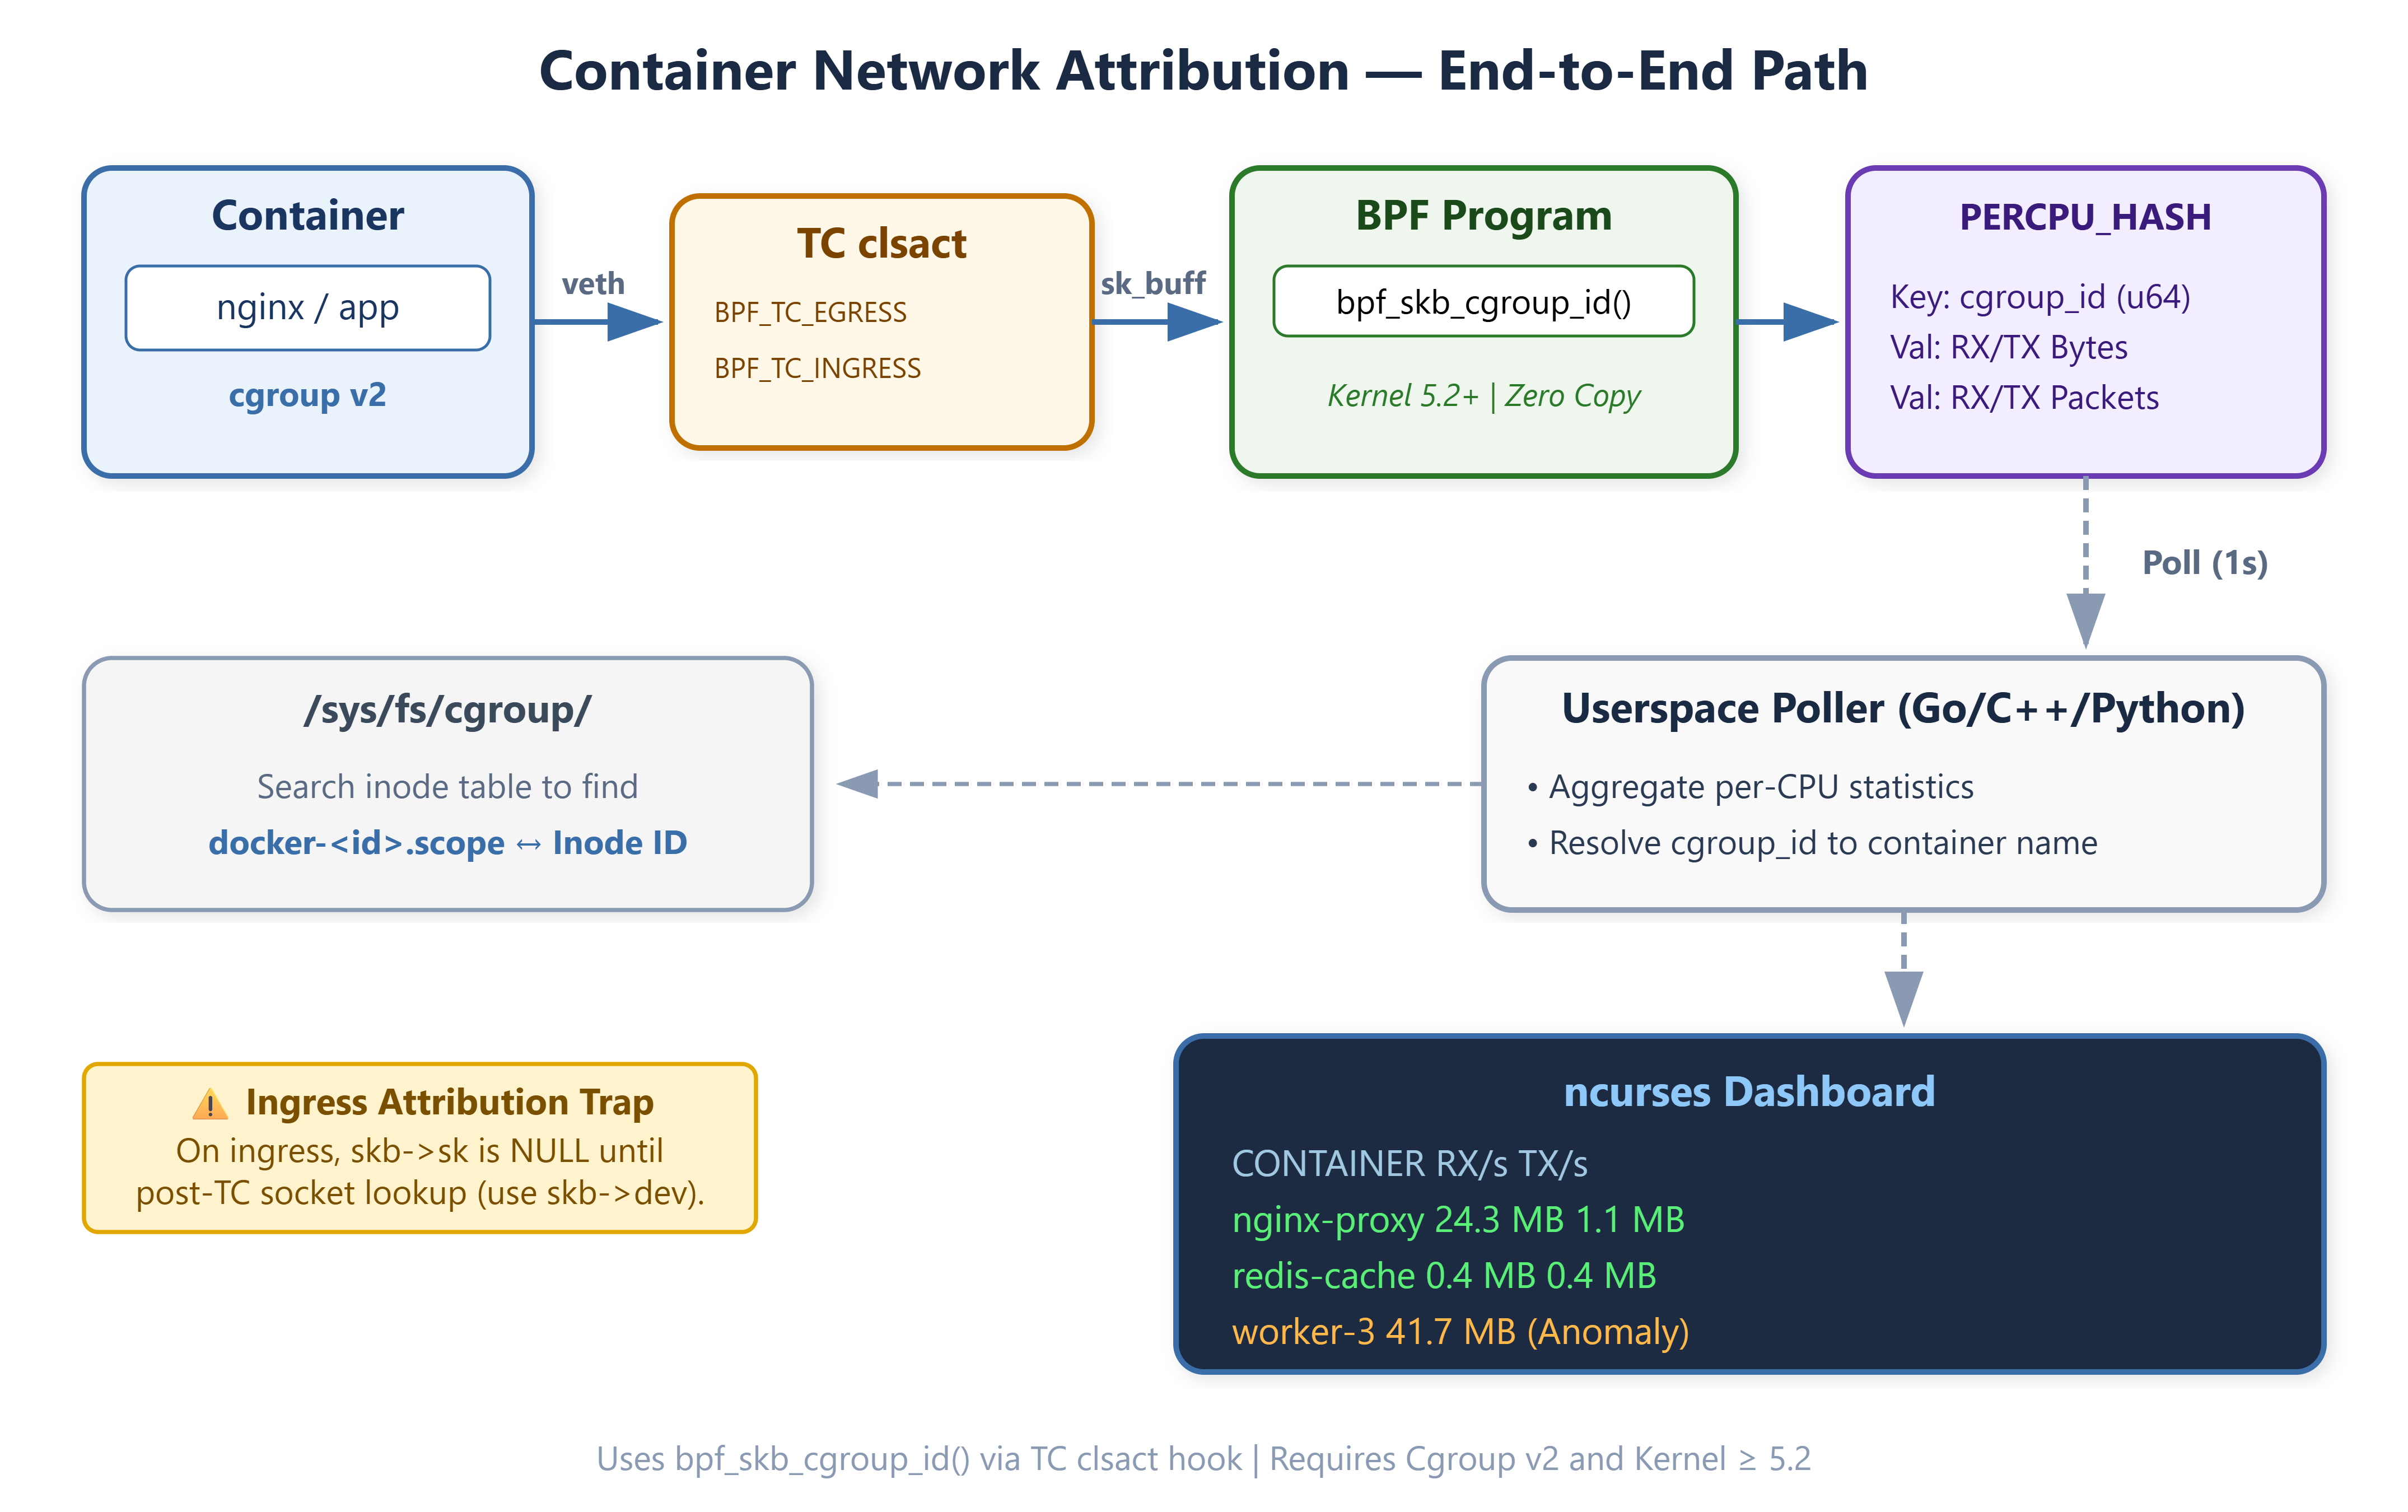
struct sk_buff. By the time a packet arrives at the Traffic Control (TC) layer, it carries a pointer toskb->sk, the owning socket. From the socket the kernel can walk to the associated task, and from the task to its cgroup. In cgroups v2 (mandatory in Ubuntu 22.04+, Debian 12, and all modern distros), every process lives in exactly one cgroup, and each cgroup has a stable 64-bit inode number — the cgroupid.The helper
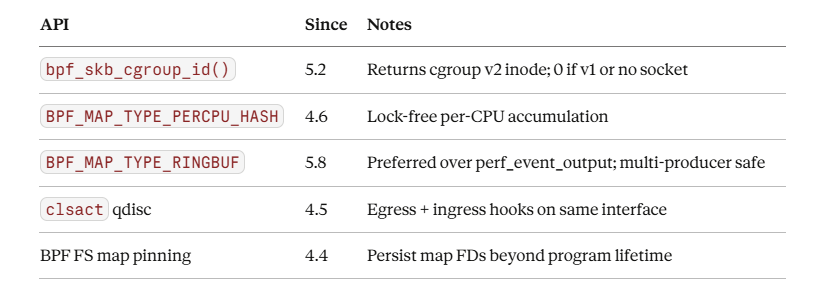
bpf_skb_cgroup_id(), available since kernel 5.2, reads that inode directly from the socket’s cgroup membership without any locking or namespace crossing. One helper call, eight bytes, and you have a stable per-container identity that outlives process churn inside the container.On egress this is straightforward:
skb->skis populated before TC runs. On ingress, it’s not — the socket lookup happens after TC. For ingress, usebpf_skb_cgroup_classid()against the cgroup’s net_cls interface, or attach at the socket layer viaBPF_PROG_TYPE_SOCK_OPSwhereskb->skis always valid. The demo hooks TC egress plus socket-level ingress to get bidirectional coverage.
Map Design: Per-CPU Aggregation at Line Rate
The naive approach — one global hash map, one entry per cgroupid, atomic increments — falls apart at 10 Gbps. Every packet on every CPU hits the same cache line, causing cross-core invalidation storms. You’ll see sys time climb and softirq latency spike.
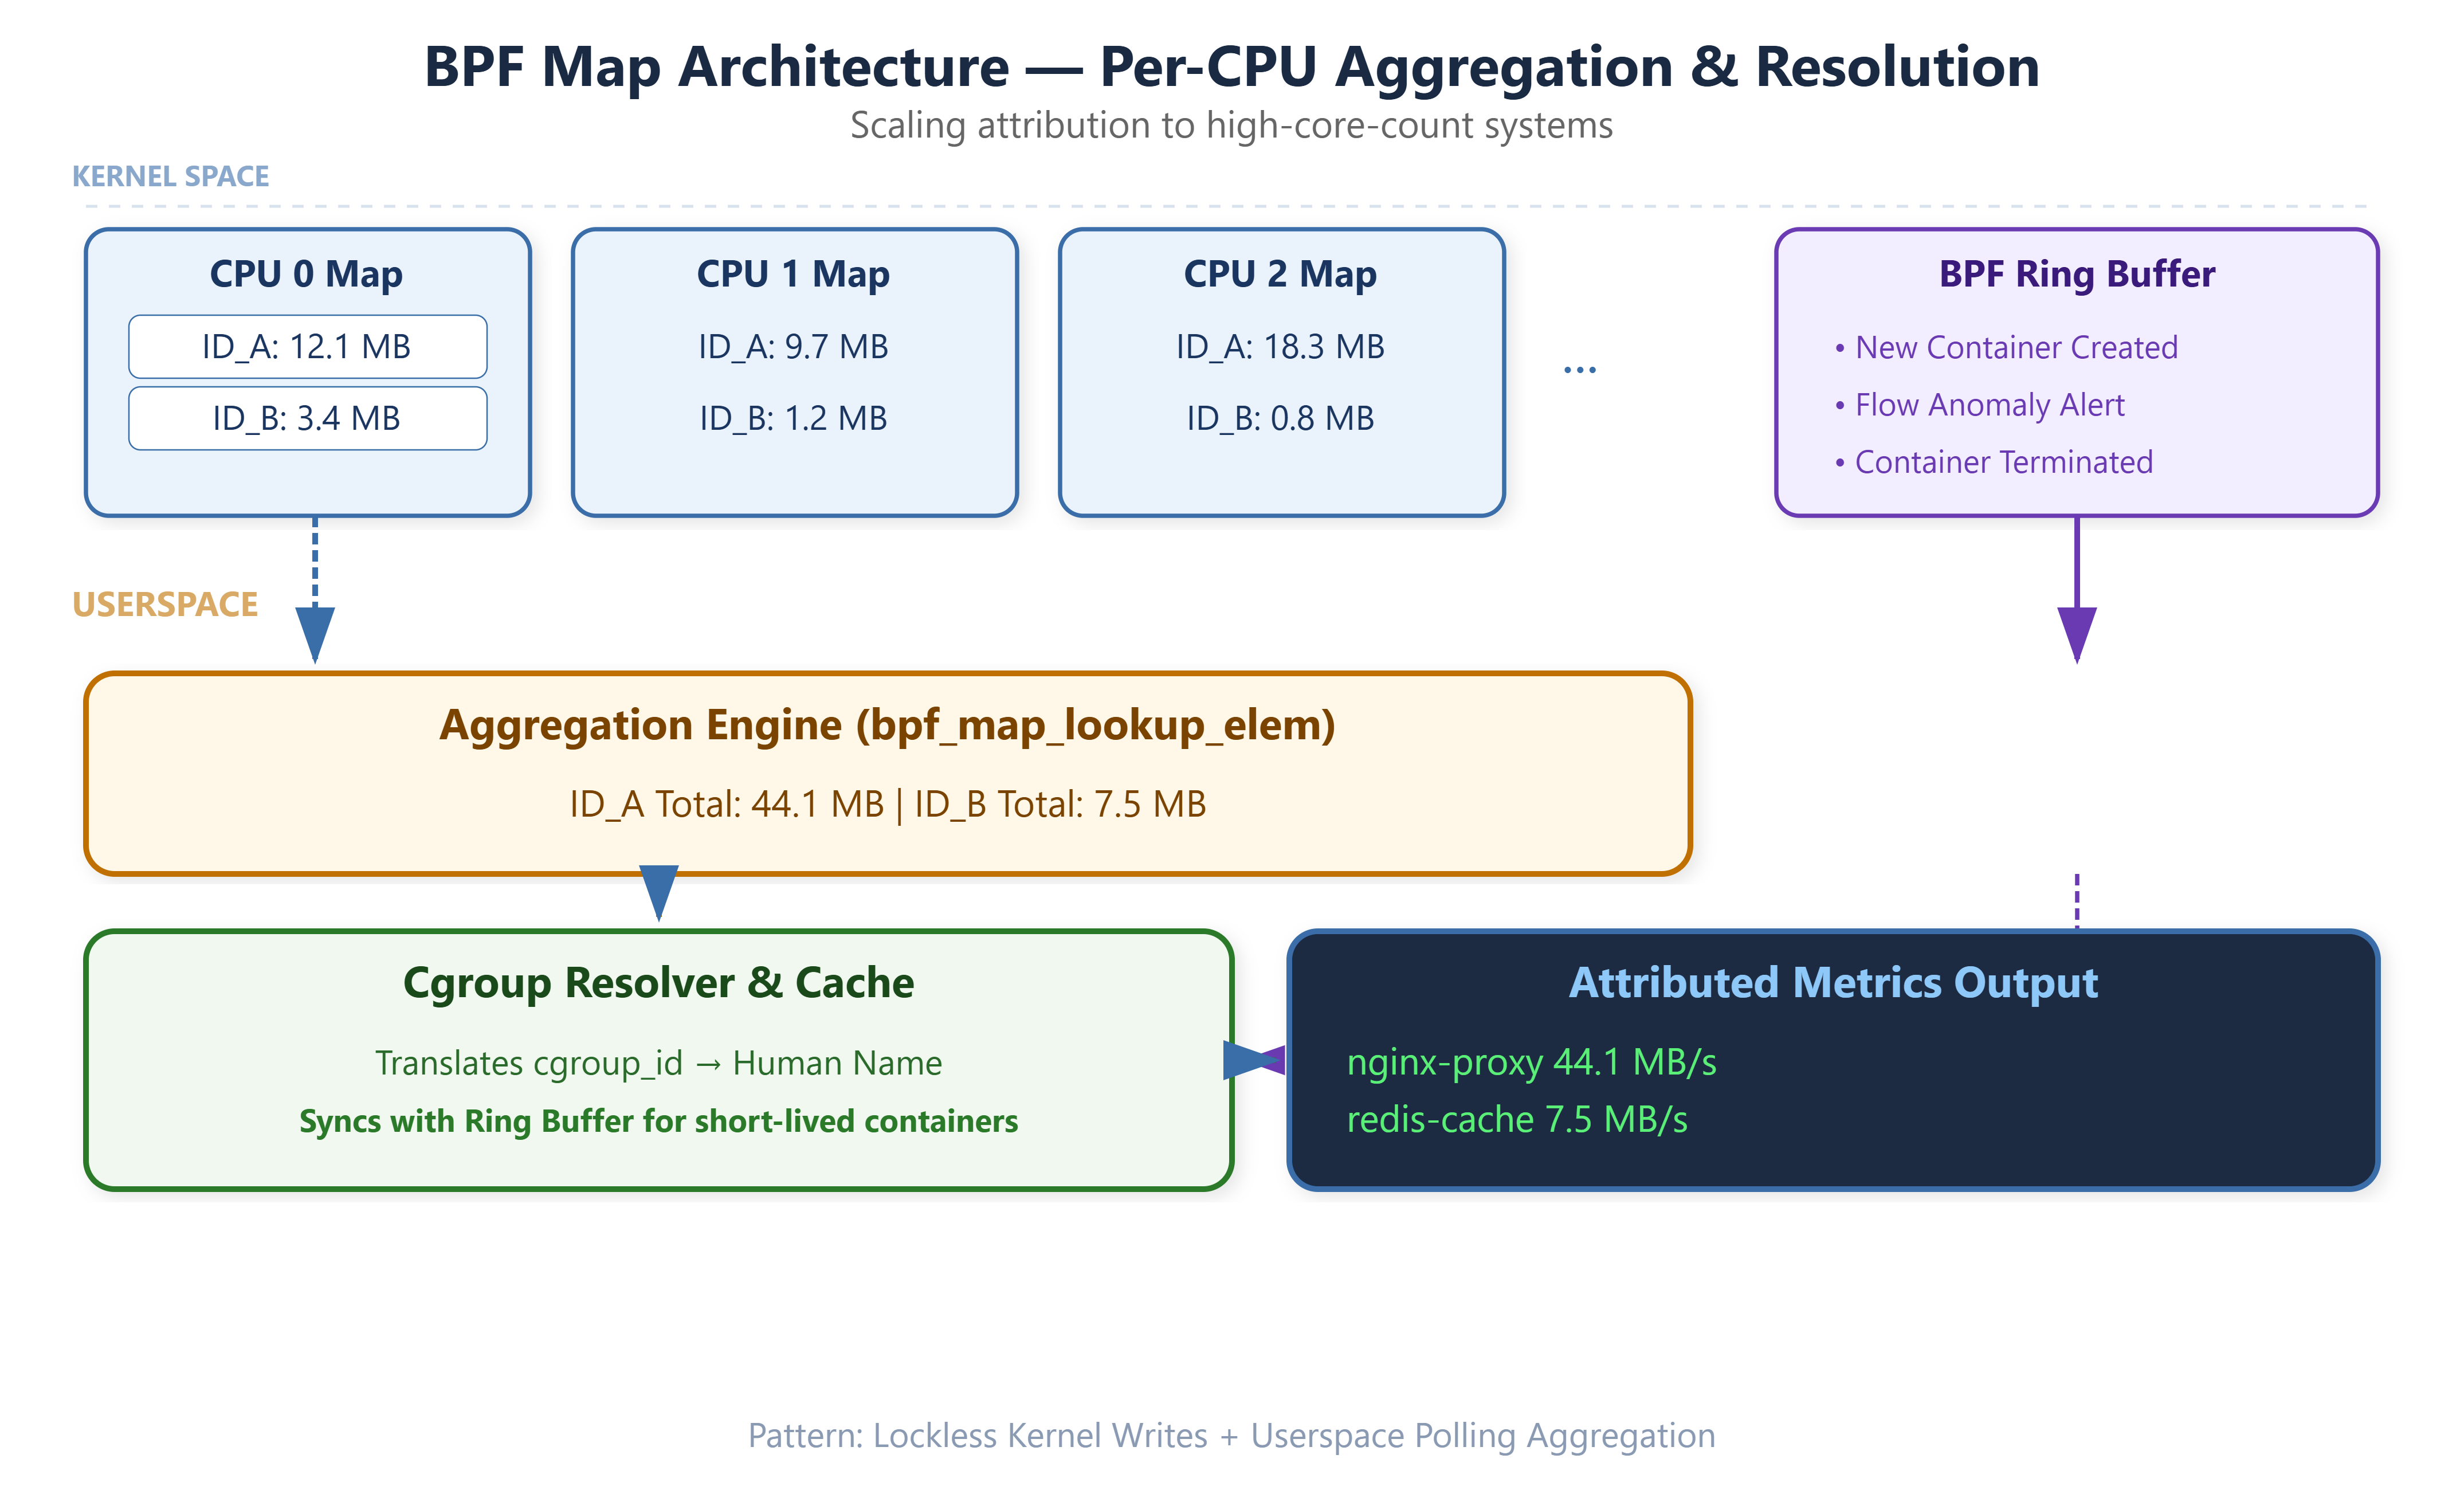
The correct structure is BPF_MAP_TYPE_PERCPU_HASH. Each CPU core maintains its own copy of every map entry; the BPF program updates the local copy without any inter-CPU coordination. Userspace reads all per-CPU values and sums them. The cost is that userspace reads are slightly more complex — you iterate nr_cpus values per key — but the kernel-side path becomes a pure cache-local store, which is what you need to not perturb the workload you’re measuring.
struct {
    __uint(type, BPF_MAP_TYPE_PERCPU_HASH);
    __uint(max_entries, 1024);
    __type(key, __u64);          /* cgroupid */
    __type(value, struct net_stats);
} stats_map SEC(".maps");

struct net_stats {
    __u64 rx_bytes;
    __u64 tx_bytes;
    __u64 rx_packets;
    __u64 tx_packets;
};
For the TC hook itself, attach to the clsact qdisc on every veth interface that fronts a container. The clsact qdisc is special: it provides both ingress and egress hook points on the same interface without requiring a dedicated ingress qdisc. You add it once per interface, then attach BPF classifiers to BPF_TC_INGRESS and BPF_TC_EGRESS.
Resolving cgroupid to Container Name
cgroupids are stable for the lifetime of the cgroup, but they’re opaque integers to operators. The resolution step happens in userspace: walk /sys/fs/cgroup/ looking for directories whose inode matches the cgroupid from the map.
/* userspace: stat each cgroup dir to get its inode */
if (stat(path, &st) == 0 && (uint64_t)st.st_ino == target_cgroupid) {
    /* extract container ID from path:
       /sys/fs/cgroup/system.slice/docker-<id>.scope */
}
Docker names its cgroup directories docker-<container-id>.scope under system.slice. containerd uses cri-containerd-<id>.scope. Kubernetes adds a pod-level cgroup above that. Parse the directory name to extract the container ID, then optionally query the container runtime socket for the human-readable name. Cache this mapping — a cgroupid_to_name hash table in userspace — because the cgroup walk is expensive and containers don’t rename themselves. Invalidate the cache when the cgroupid disappears from your BPF map (container exited) or on a configurable TTL.
Production Pitfalls
NULL sk on ingress. When a packet arrives at TC ingress, skb->sk is often NULL — socket lookup hasn’t run yet. bpf_skb_cgroup_id() will return 0 for these packets. Don’t treat 0 as a valid cgroupid; drop those samples or attribute them to a catch-all “unresolved” bucket.
GSO and byte inflation. TSO/GSO can aggregate multiple TCP segments into a single skb before TC sees it. The skb->len you read in a TC hook may represent 64 KB of logical payload but only one packet descriptor. For packet counts, correct for this by checking skb->gso_segs. For byte counts, skb->len is accurate — it’s the actual bytes on the wire after GSO segmentation runs in the NIC driver.
Short-lived containers. A container can start, push 200 MB, and exit before your 1-second poll cycle. The cgroupid is gone, the cgroup directory is unlinked, and you’ve lost attribution. Fix this with a BPF ring buffer that emits events on first-seen cgroupid; your userspace resolver subscribes to these events and resolves the name immediately, before the cgroup is removed. Cache the result indexed by cgroupid.
cgroups v1 fallback. If you’re running a legacy kernel or a host with cgroups v1 hierarchy, bpf_skb_cgroup_id() returns 0. Check at startup by reading /sys/fs/cgroup/cgroup.controllers — its existence indicates v2 unified hierarchy is mounted. Fail loudly, not silently.
What You Can Do Right Now
The demo ships a BPF program that attaches to all veth interfaces visible at startup, spins up three Docker containers running synthetic traffic, and displays per-container RX/TX in a live ncurses dashboard. Run ./demo.sh and within 30 seconds you’ll see attribution working in real time.
To extend this to your cluster: attach to eth0 in addition to veths if you want inter-node traffic visibility. Add a BPF_MAP_TYPE_LRU_HASH keyed by (cgroupid, dport) tuples to track per-service breakdown. For Kubernetes, the pod’s cgroup path contains the pod UID directly — parse it from the directory name to skip the runtime socket query entirely.
The kernel has had everything needed for this since 5.2. The only reason most teams don’t run per-container bandwidth telemetry is that no one wrote the 200 lines of BPF C to wire it up.
Part II — Implementation Guide
Prerequisites
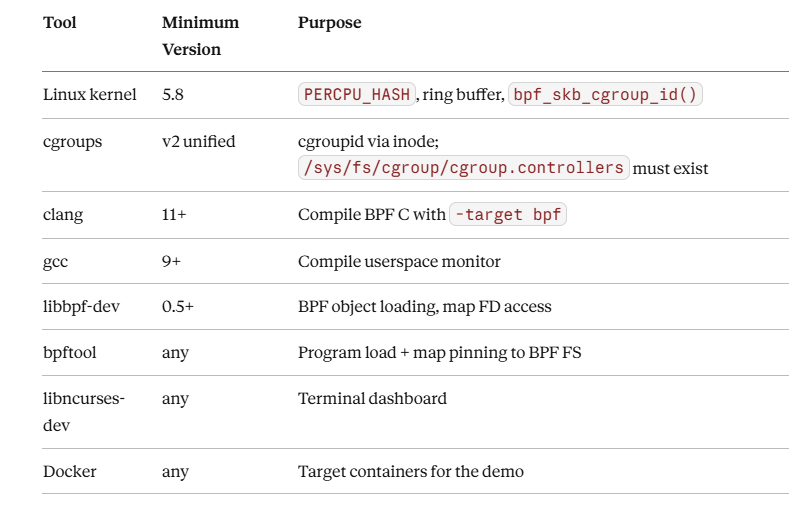
Ubuntu 22.04 LTS ships everything except bpftool, which comes from the linux-tools-$(uname -r) package.
Github Link:
Build
The build has two outputs: the BPF kernel program (.bpf.o) and the userspace monitor binary.
# Install all build dependencies
sudo apt-get install -y clang gcc make libbpf-dev libncurses-dev \
    linux-libc-dev iproute2 bpftool

# Compile the BPF kernel program
clang -O2 -g -Wall -Wextra \
    -target bpf \
    -D__TARGET_ARCH_x86 \
    -I/usr/include/x86_64-linux-gnu \
    -c net_attr.bpf.c -o net_attr.bpf.o

# Compile the userspace monitor
gcc -O2 -Wall -Wextra -Werror -std=c11 \
    -o net_attr net_attr.c \
    -lbpf -lncurses -lpthread
Or simply: make -j$(nproc)
Loading the BPF Program
The key design decision here is map pinning. If you use tc filter add dev vethX bpf obj net_attr.bpf.o repeatedly — once per interface — each invocation creates its own fresh maps. The 10 veth interfaces on a busy node would produce 10 separate, unconnected stat tables. That’s useless.
The fix is to load the object once with bpftool, pin the maps to BPF FS, and then attach the already-loaded program to each interface by reference:
# Step 1: Load once, pin program + maps
sudo bpftool prog load net_attr.bpf.o /sys/fs/bpf/net_attr_egress \
    map name stats_map pinned /sys/fs/bpf/net_attr_stats \
    map name events    pinned /sys/fs/bpf/net_attr_events \
    type tc

# Step 2: Attach to each container veth (shared map, one program FD)
for iface in $(ls /sys/class/net/ | grep ^veth); do
    sudo tc qdisc add dev "$iface" clsact 2>/dev/null || true
    sudo tc filter add dev "$iface" egress \
        bpf da pinned /sys/fs/bpf/net_attr_egress
done
All veth interfaces now feed the same stats_map. The userspace monitor opens the pinned map FD and reads everything in one place.
Running the Demo
demo.sh automates everything end-to-end:
sudo ./demo.sh
What happens, step by step:
Phase 1 — Environment checks. The script verifies kernel version (≥ 5.8), confirms cgroups v2 is the active hierarchy by checking /sys/fs/cgroup/cgroup.controllers, mounts BPF FS if it’s not already at /sys/fs/bpf, and confirms Docker is running.
Phase 2 — Build. Source files are written to ./ebpf-net-attr-demo/, then compiled. The BPF program goes through clang’s BPF backend; the monitor compiles with GCC under strict flags.
Phase 3 — Load and pin. bpftool prog load pins both the program and both maps (stats + ring buffer) to BPF FS. At this point you can already inspect the maps:
sudo bpftool map show pinned /sys/fs/bpf/net_attr_stats
# type: percpu_hash  max_entries: 512  key: 8B  value: 32B
Phase 4 — Containers. Three containers start on an isolated Docker bridge network: nginx (HTTP), redis (low-bandwidth reference), and a worker running iperf3 that generates 50 Mbps of sustained TCP traffic. A fourth container acts as the iperf3 client.
Phase 5 — TC attachment. The script walks /sys/class/net/ and attaches the pinned program to every veth* interface via tc clsact. This is the moment the kernel starts recording traffic.
Phase 6 — Dashboard. The ncurses monitor opens the pinned map FD and begins its 1-second refresh loop.
Expected Terminal Output
Before the dashboard launches, you’ll see the BPF program info and the cgroupid resolution:
  BPF Program Info
  ─────────────────────────────────────────────────────
  2: tc  name tc_egress  tag a3f12...  gpl
     loaded_at 2024-...  uid 0
     xlated 312B  jited 198B  memlock 4096B

  cgroup cgroupid Resolution Sample
  ─────────────────────────────────────────────────────
  netattr_nginx:   cgroupid=4523  (system.slice/docker-abc123.scope)
  netattr_redis:   cgroupid=4587  (system.slice/docker-def456.scope)
  netattr_worker:  cgroupid=4631  (system.slice/docker-ghi789.scope)
The dashboard then shows live per-second rates:
  eBPF Container Network Attribution | TC clsact + PERCPU_HASH | cgroups v2
  ─────────────────────────────────────────────────────────────────────────
  CONTAINER              CGROUPID           RX             TX
  ─────────────────────────────────────────────────────────────────────────
  abc123def456           4523              42.7 MB/s     0.3 MB/s
  def456ghi789           4587               0.4 MB/s     0.4 MB/s
  ghi789jkl012           4631               0.9 MB/s    48.2 MB/s
The worker shows high TX because it’s the iperf3 server sending data back to the client. Press r to walk the cgroup tree and refresh container name resolution.
Verifying Attribution Manually
You don’t need the dashboard to confirm the BPF program is working. The raw map dump tells you everything:
# Dump all per-CPU values for every cgroupid in the map
sudo bpftool map dump pinned /sys/fs/bpf/net_attr_stats

# Cross-reference: find a specific container's cgroupid
docker inspect -f '{{.Id}}' netattr_worker | head -c 12 | xargs -I{} \
    find /sys/fs/cgroup -name "docker-{}*" -exec stat -c '%i %n' {} \;
If the inode from stat matches a key in the map dump, attribution is working correctly.
Reference: Key Kernel APIs
Cleanup
sudo ./cleanup.sh
This removes all TC filters from every veth* interface, deletes BPF FS pins, stops and removes Docker containers, and wipes the build directory.