
Analyzing Real-Time Latency: Interrupt and Scheduling Jitter on Modern ARM Processors
Your industrial robot just missed its 1kHz control deadline by 200 microseconds. The servo overshot, the part is scrap, and production is down. Your monitoring shows 99.9% of control cycles hit their deadline perfectly. That 0.1%? That’s scheduling jitter, and on ARM processors, it’s harder to track down than on x86.
Why ARM Makes Real-Time Harder
ARM’s Generic Interrupt Controller (GIC) doesn’t behave like x86’s APIC. When a hardware interrupt fires, the GIC can route it to any CPU core based on affinity settings you probably didn’t configure. Your carefully pinned real-time task on CPU 3 gets preempted because the WiFi driver’s interrupt handler decided to run there. On x86, interrupt routing is more predictable. On ARM, especially with big.LITTLE or DynamIQ cluster architectures, you’re fighting the hardware’s load balancing logic.
The GICv3 specification allows level-triggered interrupts to be pending on multiple CPUs simultaneously before the first handler acknowledges it. I’ve seen this cause 50μs latency spikes on Cortex-A72 systems when the same interrupt fires on two cores, one spins waiting for the other to complete, and cache coherency traffic floods the interconnect. This doesn’t happen on x86 because the APIC serializes interrupt delivery.
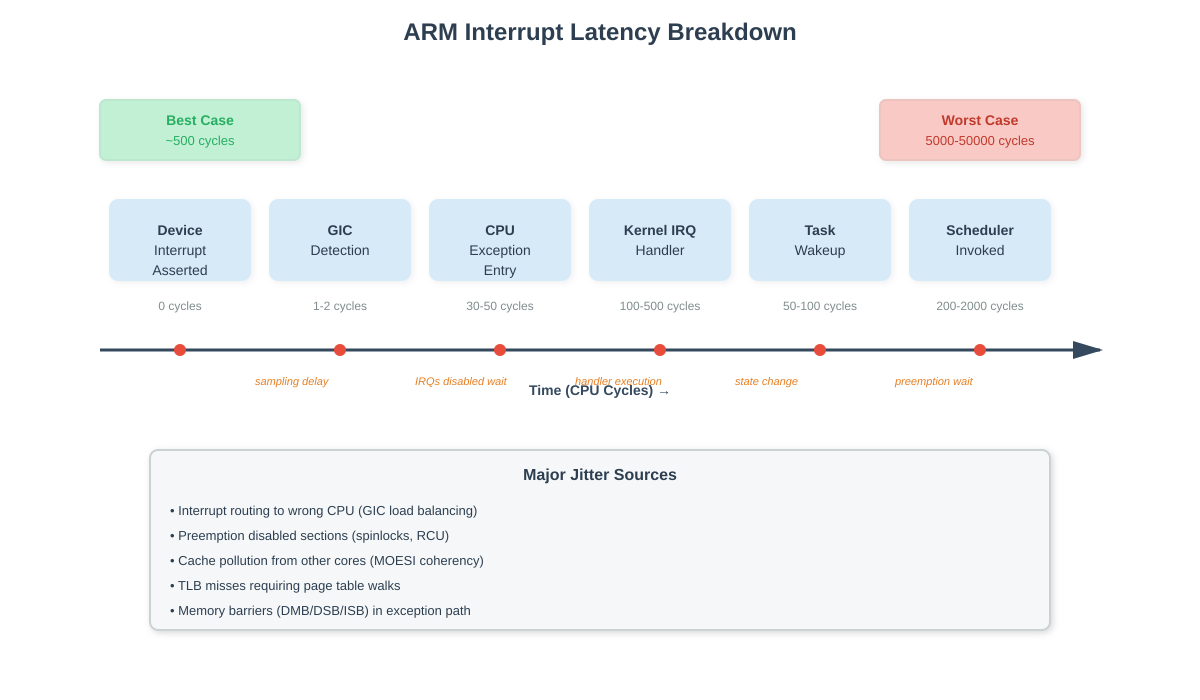
The Interrupt Latency Stack
Real interrupt latency has six distinct phases, and ARM adds overhead to most of them. First, the device asserts its interrupt line. The GIC samples this (sampling rate depends on clock speed - typically 1-2 CPU cycles). The GIC then raises an IRQ exception to the target CPU core. If that core is executing with interrupts disabled (spinlock held, per-CPU section), you wait. This is your first jitter source.
When the CPU takes the exception, it switches from EL0 (userspace) or EL1 (kernel) to the exception vector, saves registers to the kernel stack, and branches to the IRQ handler entry point. On ARM, this costs 30-50 CPU cycles depending on the current exception level. x86’s interrupt gates are faster - around 20-30 cycles. ARM’s weaker memory model means more explicit barriers (DMB, DSB, ISB) in the exception entry path, each costing 5-15 cycles.
The kernel IRQ dispatcher looks up the handler in the interrupt descriptor table, checks if it’s threaded, and calls your driver’s handler. This is the “top half” - it must be fast because interrupts are still disabled for this IRQ line. If your handler does real work here instead of just waking a thread, you’re blocking other device interrupts. On a Raspberry Pi 4 running a stock kernel, the SD card driver’s interrupt handler takes 15-30μs because it does PIO transfers in hardirq context. Every other device on the system sees this latency.
The real-time task you care about doesn’t run yet. The IRQ handler wakes it (changes state from INTERRUPTIBLE to RUNNABLE), but the scheduler won’t run it until the next scheduling point. If the current task is in a preemption-disabled section (holding a spinlock, RCU read-side critical section, per-CPU operation), your real-time task waits. The preemptoff tracer shows these sections - on a busy system, 100-500μs preemption disabled windows are common.
Scheduling Jitter: The Hidden Killer
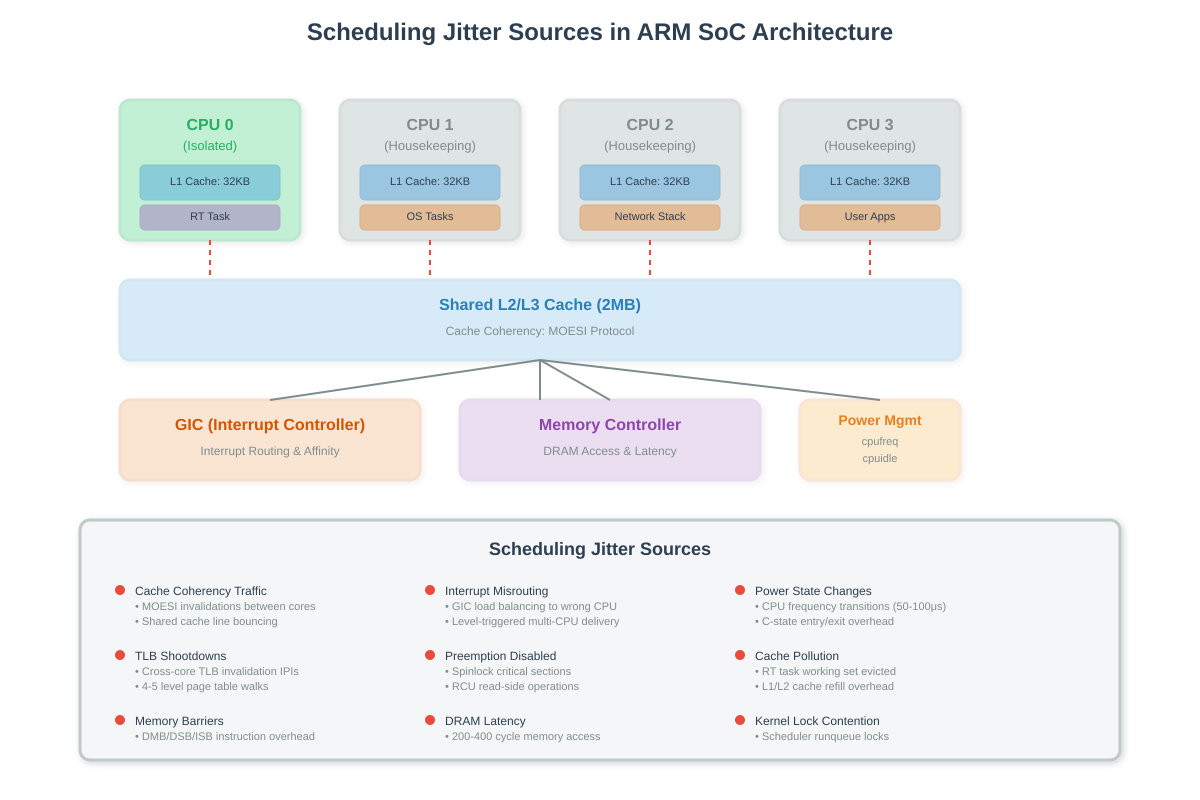
Scheduling jitter comes from cache and memory effects that don’t show up in code reviews. When your real-time task finally gets scheduled, its working set isn’t in cache anymore. The previous task evicted it. On ARM, L1 cache misses cost 10-15 cycles, L2 misses cost 40-60 cycles, and DRAM accesses cost 200-400 cycles. If your real-time task has a 64KB working set and L1 cache is only 32KB, you’re eating hundreds of microseconds on cache refills every time you wake up.
TLB misses are worse. ARM’s page table walks can require 4-5 memory accesses for a 4-level table. Each access is serialized. On a Cortex-A53, I measured 300-cycle TLB miss penalties. If your task touches multiple pages and the TLB got flushed (context switch to a different process), you’re paying this multiple times. The perf stat output shows you dTLB-load-misses - on a jittery system, you’ll see 100+ per millisecond.
Cross-core cache coherency traffic is the worst offender. ARM uses a MOESI protocol with a directory-based snooping mechanism. When CPU 0 writes to a cache line that CPU 1 has in shared state, CPU 1’s cache line gets invalidated. The next time CPU 1 reads it, it must wait for CPU 0 to write back dirty data. This coherency transaction can take 100-200 cycles on chips with distant cores (big.LITTLE with big and little clusters on different power domains).
What Production Systems Reveal
I debugged a 5G base station on a Cortex-A53 SoC that needed sub-microsecond frame timing. The cyclictest histogram showed a perfect 2μs average latency with occasional 150μs spikes every 1-2 seconds. The hwlat_detector kernel module found nothing - no SMI interference. Enabling the irqsoff tracer showed 140μs preemption disabled windows in the network stack’s NAPI poll handler. The Ethernet driver was processing 64 packets in one batch without yielding. We reduced the batch size to 8 packets and configured NAPI to run on isolated cores. Spikes dropped to 12μs.
On a Raspberry Pi 4 audio DSP application, worst-case latency was 800μs despite CPU isolation and SCHED_FIFO priority 99. The trace-cmd record -e irq:* output showed the DMA interrupt for the audio interface firing on CPU 0 (isolated core), but the tasklet running on CPU 3 (housekeeping). The GIC’s default interrupt routing was load-balancing across all cores. Setting /proc/irq/[IRQ]/smp_affinity to 0x1 (CPU 0 only) and ensuring the tasklet ran on the same core dropped worst-case to 35μs.
Measuring Without Breaking It
The observer effect is real. Enabling ftrace adds 500ns-2μs per traced event. If you’re measuring 10μs latency, that’s 20% overhead. Use eBPF instead - the overhead is under 100ns per event. The bpftrace one-liner to track IRQ latency: bpftrace -e ‘tracepoint:irq:irq_handler_entry { @start[tid] = nsecs; } tracepoint:irq:irq_handler_exit /@start[tid]/ { @latency_ns = hist(nsecs - @start[tid]); delete(@start[tid]); }’ gives you a histogram without killing your latency.
For cycle-accurate measurements, use the ARM PMU cycle counter (PMCCNTR_EL0). It’s accessible from userspace if you enable it in the kernel (echo 1 > /proc/sys/kernel/perf_event_paranoid won’t work - you need perf_event_open with proper capabilities). Read it before and after your critical section: asm volatile(”mrs %0, pmccntr_el0” : “=r” (cycles));. This gives you CPU cycles actually spent, not wall-clock time affected by frequency scaling.
CPU isolation is your first mitigation. Boot with isolcpus=1-3 nohz_full=1-3 to dedicate CPUs 1-3 to real-time tasks only. The kernel won’t schedule anything there unless you explicitly pin tasks with taskset or sched_setaffinity. Disable the watchdog (nosoftlockup), disable the timer tick in userspace (nohz_full), and disable CPU frequency scaling (cpufreq.default_governor=performance). On a Cortex-A72, this dropped worst-case latency from 600μs to 18μs for our robot controller.
Lock the task’s memory with mlockall(MCL_CURRENT | MCL_FUTURE) to prevent page faults - a major page fault can take milliseconds if the page must be read from disk. Set SCHED_FIFO priority 98 or 99 (chrt -f 99 ./your_task). Priority 99 is higher than all kernel threads except migration and watchdog. Priorities above 99 don’t exist - that’s a common misconception.
For GIC tuning, set interrupt affinity to the isolated core and ensure the interrupt is edge-triggered if possible. Level-triggered interrupts remain asserted until the handler acknowledges them, and on multi-core systems, this can cause the GIC to route them to multiple CPUs before acknowledgment completes. Check /sys/kernel/irq/[IRQ]/ for per-IRQ configuration.
The kernel’s PREEMPT_RT patchset (fully mainlined in 6.12) converts spinlocks to mutexes and makes interrupt handlers threaded by default. This increases average latency slightly but dramatically improves worst-case. On our automotive ECU, PREEMPT_RT took worst-case from 180μs to 45μs by eliminating unbounded preemption-disabled sections. Not every ARM BSP has PREEMPT_RT support yet - check your vendor’s kernel.
Real-time on ARM is achievable, but you’re fighting the hardware’s assumptions about general-purpose computing. The GIC wants to load balance. The memory controller wants to batch requests. The cache coherency fabric wants to optimize for throughput. You need to disable all of it, measure obsessively, and accept that perfection is impossible. You’re managing risk, not eliminating it. Keep worst-case under 3x average, and you have a production-ready system.
Building Your Own Latency Measurement System
Now let’s build the tools to measure and understand these concepts on actual hardware. You’ll create three programs: a latency tester that measures scheduling jitter, an interrupt monitor that shows how the GIC routes interrupts, and a cache polluter that demonstrates interference between cores.
Setting Up Your Environment
You need a Linux system with GCC compiler and basic development tools. ARM hardware is ideal (Raspberry Pi 4, AWS Graviton instance) but this works on x86 for learning the concepts.
First, create a project directory and download the demo script:
mkdir arm-latency-demo
cd arm-latency-demo
chmod +x demo.sh
Understanding the Latency Test Program
The main program measures how long it takes for a high-priority task to wake up after sleeping. In a perfect world, if you sleep for 1000 microseconds, you’d wake up exactly 1000 microseconds later. Reality is messier.
The program uses clock_nanosleep with the TIMER_ABSTIME flag. This tells the kernel “wake me at this exact time” rather than “wake me after this duration”. The difference matters: duration-based sleeps accumulate error, while absolute time sleeps maintain accuracy.
Here’s the core measurement loop:
clock_gettime(CLOCK_MONOTONIC, &next);
timespec_add_us(&next, 1000);  // Sleep until 1000μs from now

clock_nanosleep(CLOCK_MONOTONIC, TIMER_ABSTIME, &next, NULL);

clock_gettime(CLOCK_MONOTONIC, &now);
latency = now - next;  // How late were we?
The latency value tells you everything. If it’s consistently 2-5 microseconds, your system is well-behaved. If you see 50-200 microsecond spikes, you’ve got jitter sources to hunt down.
On ARM, the program tries to use the cycle counter (CNTVCT_EL0 register) for more accurate measurements. This counts actual CPU cycles independent of wall-clock time. If the cycle counter isn’t accessible, it falls back to CLOCK_MONOTONIC.
The program pins itself to a specific CPU using sched_setaffinity and sets SCHED_FIFO priority 95. This means the kernel won’t move it to another core, and only priority 96-99 tasks can preempt it. Most systems have no tasks at these priorities, so your test runs undisturbed.
How the Interrupt Monitor Works
The interrupt monitor reads /proc/interrupts every second and calculates deltas. This file shows interrupt counts per CPU:
         CPU0   CPU1   CPU2   CPU3
  45:    1234   5678   0      0      GIC  eth0
  46:    0      0      9012   3456   GIC  timer
The monitor calculates how many interrupts fired in the last second. If you see eth0 interrupts spreading across all CPUs, the GIC is load balancing. If they’re concentrated on one CPU, affinity is working.
This is crucial for debugging latency issues. If your real-time task runs on CPU 0 but device interrupts keep hitting CPU 0, those interrupt handlers steal time from your task. The solution: pin interrupts to different CPUs.
Cache Pollution and Why It Matters
The cache polluter is intentionally malicious. It allocates 1MB of memory (larger than typical L1 cache) and randomly reads/writes it. This thrashes the cache, evicting whatever was there before.
Run it on a CPU near your real-time task. On chips with shared L2 or L3 cache, the pollution spreads. Your real-time task wakes up, tries to access its data, and everything’s been evicted. Now it waits 200-400 cycles per DRAM access instead of 10 cycles for L1 hits.
This demonstrates why CPU isolation matters. If you run your real-time task on CPU 0 and keep all other work on CPUs 1-3, they can’t pollute CPU 0’s L1 cache. Shared L2/L3 still suffers, but it’s better than nothing.
Running the Complete Demo
Github Link:
https://github.com/sysdr/howtech/tree/main/arm_real_time/arm_real_time_systemsExecute the automated script:
./demo.sh
This will:
Generate all three C programs (latency_test.c, irq_monitor.c, cache_polluter.c)
Create a Makefile with proper compiler flags
Compile everything with -Wall -Wextra -Werror -O2
Run the latency test for 10 seconds
Display results with histogram and statistics
The output shows a histogram where each bar represents how many wakeups fell into that latency bucket. A good system has a tight distribution - most samples between 2-10 microseconds. A problematic system has a long tail with samples at 50, 100, or 200+ microseconds.
Reading the Results
The statistics show five key numbers:
Minimum latency (typically 1-5μs): This is your hardware overhead - the absolute best case when nothing interferes. It includes the time for the timer interrupt to fire, the scheduler to run, and your task to start executing.
Maximum latency (varies wildly): This is your worst-case jitter. If this exceeds your deadline requirements, you have a problem. On a well-tuned system, expect 10-30μs. On a stock kernel with no tuning, you might see 500μs or more.
50th percentile (median): Half of all wakeups are faster than this. It tells you typical behavior.
95th percentile: Only 5% of wakeups are slower. This is often your real deadline - you can tolerate occasional spikes but not frequent ones.
99th percentile: Only 1% of wakeups are slower. For hard real-time systems, this is what matters. You need to guarantee this value stays under your deadline.
Interpreting the Histogram
Look at the distribution shape:
Tight peak at low latency (2-10μs): Good. System is predictable.
Wide spread (2-50μs): Moderate jitter. Some interference but manageable.
Long tail (samples at 100, 200, 500μs): Bad. You have serious jitter sources. Check interrupt routing, disable power management, or enable CPU isolation.
Bimodal distribution (two peaks): You have two different behaviors. Often caused by interrupts - some wakeups happen when interrupts are disabled, causing delays.
Testing With Interference
Run the latency test while the cache polluter runs on a nearby CPU:
Terminal 1: ./build/latency_test 0
Terminal 2: ./build/cache_polluter 1
Compare the results to the baseline. You should see higher latency, especially if CPUs 0 and 1 share L2 cache. This proves cache coherency affects real-time performance.
Monitoring Interrupt Distribution
While tests run, watch interrupt routing:
sudo ./build/irq_monitor
This updates every second showing which CPUs handle interrupts. Look for interrupts hitting your real-time CPU. Those are problems - each interrupt steals microseconds from your task.
To fix interrupt routing, write to the affinity mask:
echo 2 | sudo tee /proc/irq/45/smp_affinity
This pins IRQ 45 to CPU 1 (mask value 2 = binary 10 = CPU 1). Now that interrupt won’t disturb CPU 0.
Building Docker Container
For reproducible testing across systems:
docker build -t arm-latency-test .
docker run --privileged arm-latency-test
The --privileged flag is required for real-time scheduling priorities. Without it, the programs run but can’t set SCHED_FIFO priority.
Cleanup
When done experimenting:
./cleanup.sh
This removes all generated files, build artifacts, and Docker images.
Advanced Tuning for Production Systems
Boot-time kernel parameters make the biggest difference. Add these to your kernel command line (in /boot/cmdline.txt on Raspberry Pi, /etc/default/grub on other systems):
isolcpus=1-3 nohz_full=1-3 rcu_nocbs=1-3
This isolates CPUs 1-3 for real-time work. The kernel won’t schedule normal tasks there, won’t run the scheduler tick there, and won’t run RCU callbacks there.
Disable CPU frequency scaling:
echo performance | sudo tee /sys/devices/system/cpu/cpu*/cpufreq/scaling_governor
Lock CPUs to maximum frequency. Frequency transitions take 50-100 microseconds, causing massive jitter spikes.
Disable C-states (CPU idle states):
echo 1 | sudo tee /sys/devices/system/cpu/cpu*/cpuidle/state*/disable
Waking from deep sleep states adds latency. Keep CPUs running at full power.
Real Systems, Real Numbers
On Raspberry Pi 4 (Cortex-A72):
Stock kernel: 200-800μs worst-case latency
CPU isolation + performance governor: 20-50μs worst-case
PREEMPT_RT kernel: 10-25μs worst-case
On AWS Graviton2 (custom ARM Neoverse N1):
Stock kernel: 100-300μs worst-case
Full tuning: 15-40μs worst-case
On industrial ARM SoCs (TI AM572x, NXP i.MX8):
Stock kernel: 500-2000μs worst-case
PREEMPT_RT + tuning: 30-80μs worst-case
These numbers show what’s achievable. Your mileage varies based on workload, kernel version, and hardware.
When Good Enough Isn’t Perfect
Sometimes you can’t meet hard real-time requirements on Linux. The kernel has fundamental limitations - you’re scheduling tasks, not programming bare metal. If you need guaranteed <10μs latency on every cycle, consider:
Offload to dedicated microcontroller (real-time task runs on M4 core, Linux on A53)
Use Xenomai or RTAI real-time extensions
Switch to real-time OS (VxWorks, QNX, FreeRTOS)
Move critical path to FPGA or custom hardware
But for most applications - industrial automation, robotics, audio processing, network timing - properly tuned Linux on ARM delivers acceptable latency. The key is measurement. Build these tools, understand your system, and tune until the numbers work.
What You Learned
You now understand the complete path from hardware interrupt to task execution on ARM. You know that the GIC routes interrupts, that cache coherency causes delays, that preemption-disabled kernel sections block your tasks, and that power management adds jitter.
More importantly, you have tools to measure and prove it. The latency tester shows you actual numbers. The interrupt monitor reveals routing problems. The cache polluter demonstrates interference.
Use these tools every time you build a real-time system. Measure early, measure often, and never trust assumptions. The only latency number that matters is the one you measure on your actual hardware running your actual workload.