Advanced htop and ps Techniques for Live System Monitoring
Understanding Process Monitoring from the Inside Out
Last month, a production PostgreSQL server was showing 800% CPU in htop. The on-call engineer panicked—how could one process use 8 cores? The real answer wasn’t in htop’s display. It was in understanding what htop actually measures and where it gets that data.
What Your Monitor Is Actually Doing
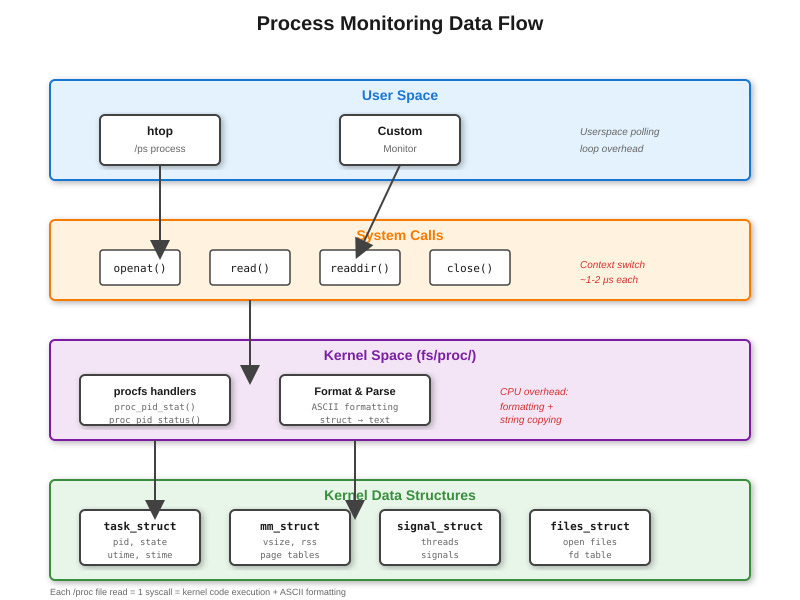
Every time htop refreshes, it’s walking /proc. Open /proc/1234/stat and you’ll see a single line with 52 space-separated fields. That’s where your CPU percentage comes from—field 14 (utime) and field 15 (stime), measured in clock ticks since process start. htop reads this, calculates the delta from last sample, divides by elapsed time and number of CPUs, and shows you a percentage.
The problem? This calculation happens in userspace. htop has no special kernel access. It’s just doing math on files that the kernel writes to procfs. When you run
strace htop, you’ll see hundreds of openat() and read() syscalls per second. Each /proc/[pid]/stat read triggers a kernel code path that walks task_struct fields and formats them into ASCII.